The web UI
domarinn server serves a React single-page app at the web root, out of the same binary as the JSON API — there is no second thing to deploy. Client-side routing means the service wants its own hostname, not a path prefix. See Server for auth and environment variables, and Self-hosting for getting it running.
| Path | Page | What it does |
|---|---|---|
/ |
Overview | Per-suite status: the latest CI run, its trend, and staleness. Sorted by severity, never by recency. |
/runs |
Runs list | Browse and filter runs (project, suite, tag, branch, status, origin, actor). |
/runs/:id |
Run detail | Every case with its assertions; click one for the detail drawer. |
/runs/:id?view=matrix |
Matrix view | The same run pivoted to prompt × provider. |
/runs/:id/compare[/:other] |
Compare | Base/head pickers, regression highlighting, and the significance test. |
/sets |
Run sets | Every project you can reach, and who may reach it. |
/sets/:project |
Run sets | That project's suites, with their trends, baselines and locks. |
/sets/:project/:suite |
One suite | One suite's record, plus the access panel. |
/search?q= |
Search | Full-text across runs and case outputs. |
/cache |
Cache stats | The server's shared cache tier: entries, size, hit/miss counters. |
/settings |
Settings | Account, appearance, and what this server is running. |
/login |
Login | Username/password sign-in, plus any configured SSO buttons. |
/setup |
Setup | First-run admin creation (only while setup_required). |
/keys |
API keys | Create, view once, and revoke your API keys. |
/admin |
Admin | Manage accounts. Admin-only. |
Where these screenshots come from
Every image below is a real capture, not a mock-up: mise run screenshots starts a throwaway server, seeds it with actual runs of the shipped examples against a loopback Ollama, and drives a browser at 1920×1080 in both themes. That is why the actor reads demo, the host reads docs-seed, the numbers are small, and the access list names three seeded accounts, one per grant level — this is a demo instance with two dozen runs on it, and it shows you exactly what you will see.
Login
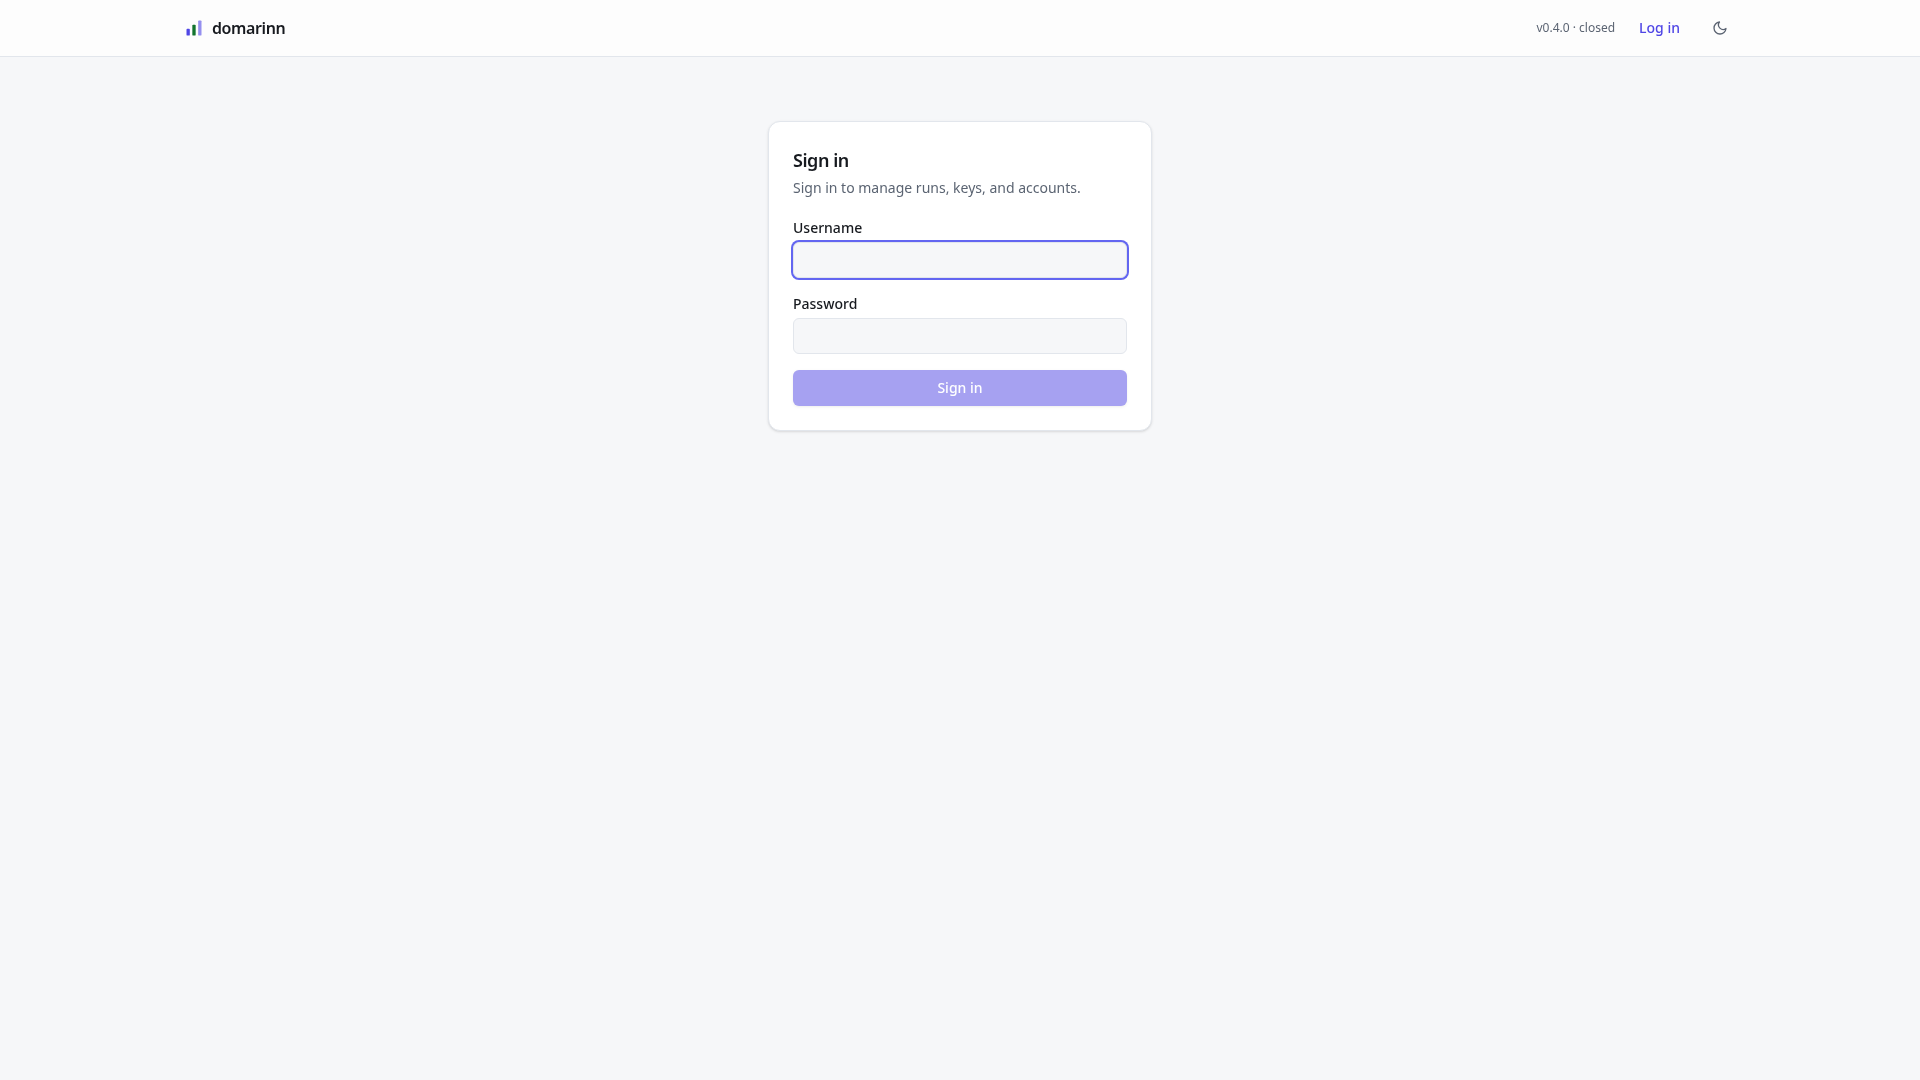
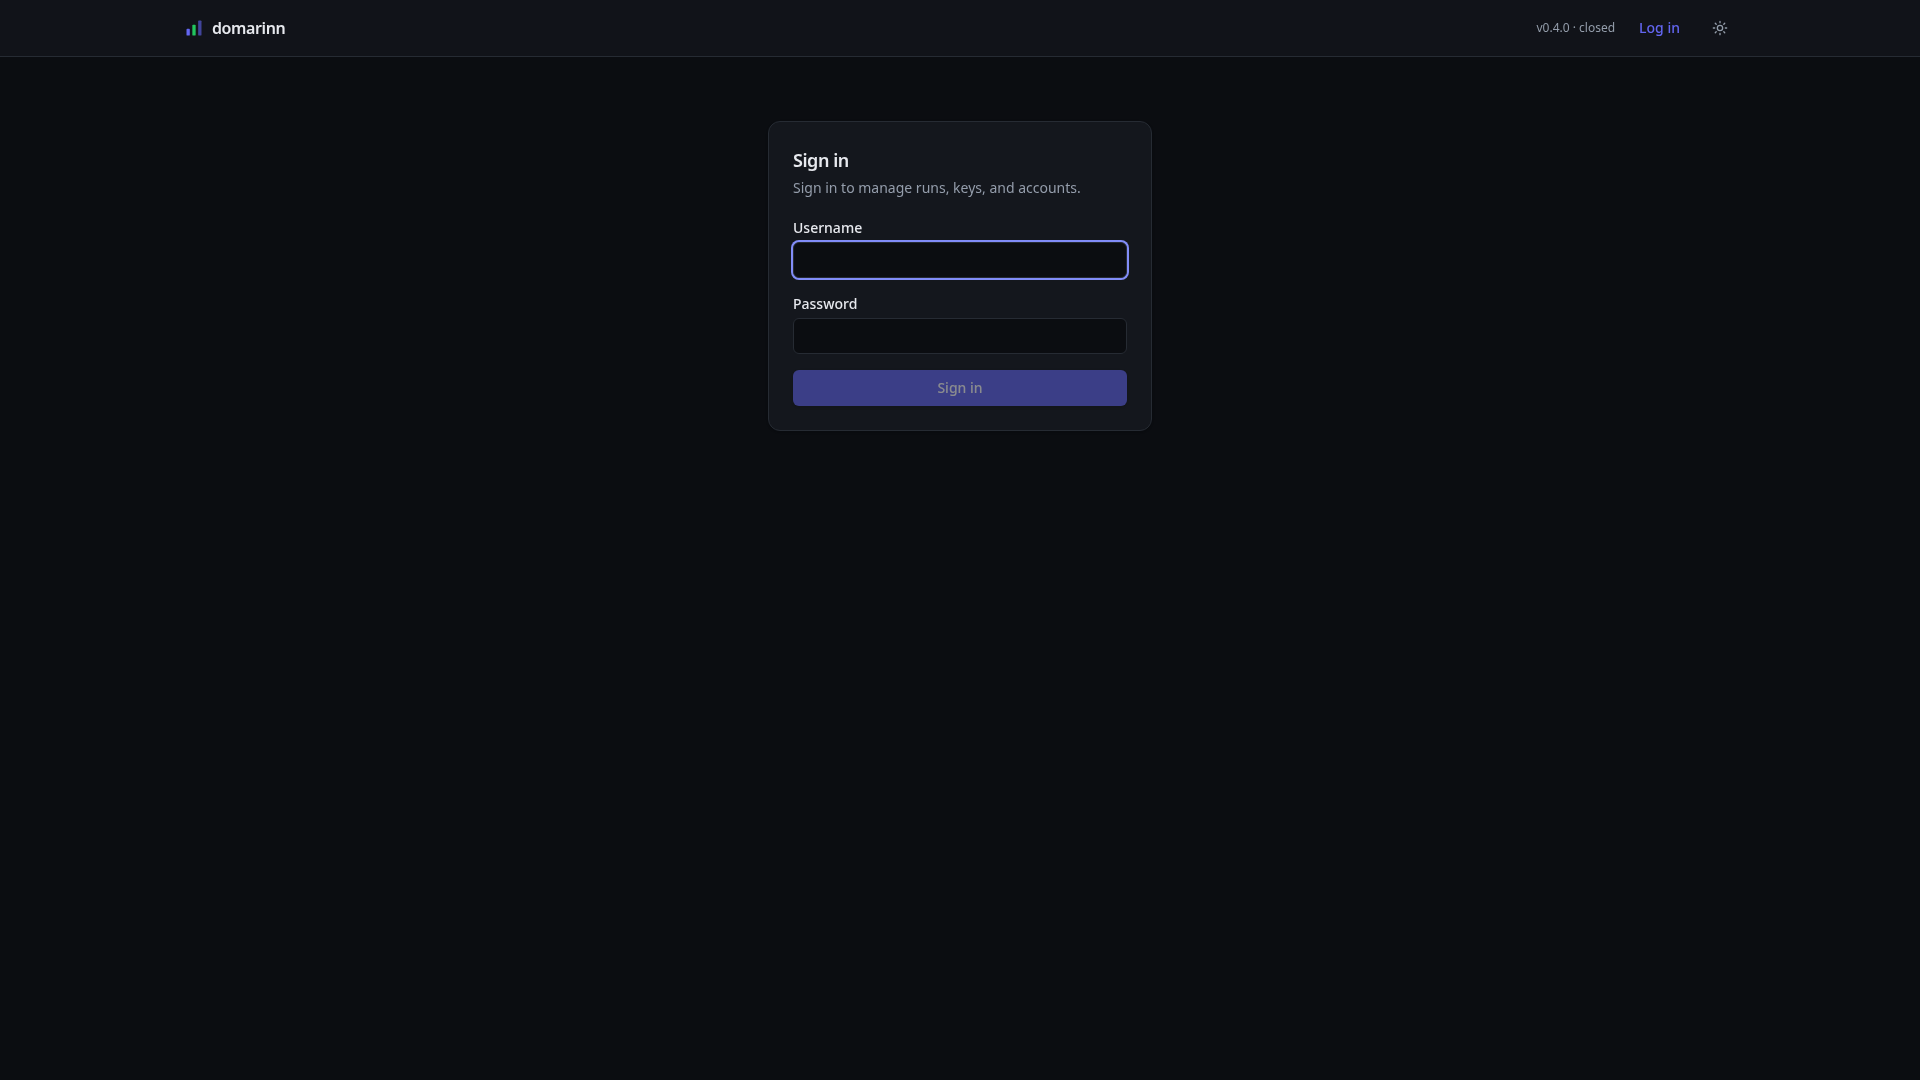
The server is closed by default, so this is the first page an unauthenticated visitor lands on whatever URL they asked for. The card takes a username and password and mints a 30-day session cookie; the header strip on the right reports the build and the active auth mode (v0.4.0 · closed here), which is the fastest way to confirm which mode a deployment actually came up in.
Nothing else appears on this page unless you configured it. Each OIDC or SAML provider adds a "Continue with …" button below the password form, and an SSO-only account cannot use the form at all. On a fresh install with zero users this route redirects to /setup instead, which creates the first admin.
The theme toggle in the header (the moon, or the sun in dark mode) is available before login and is remembered locally — useful when you are about to paste a screenshot into a ticket.
Overview
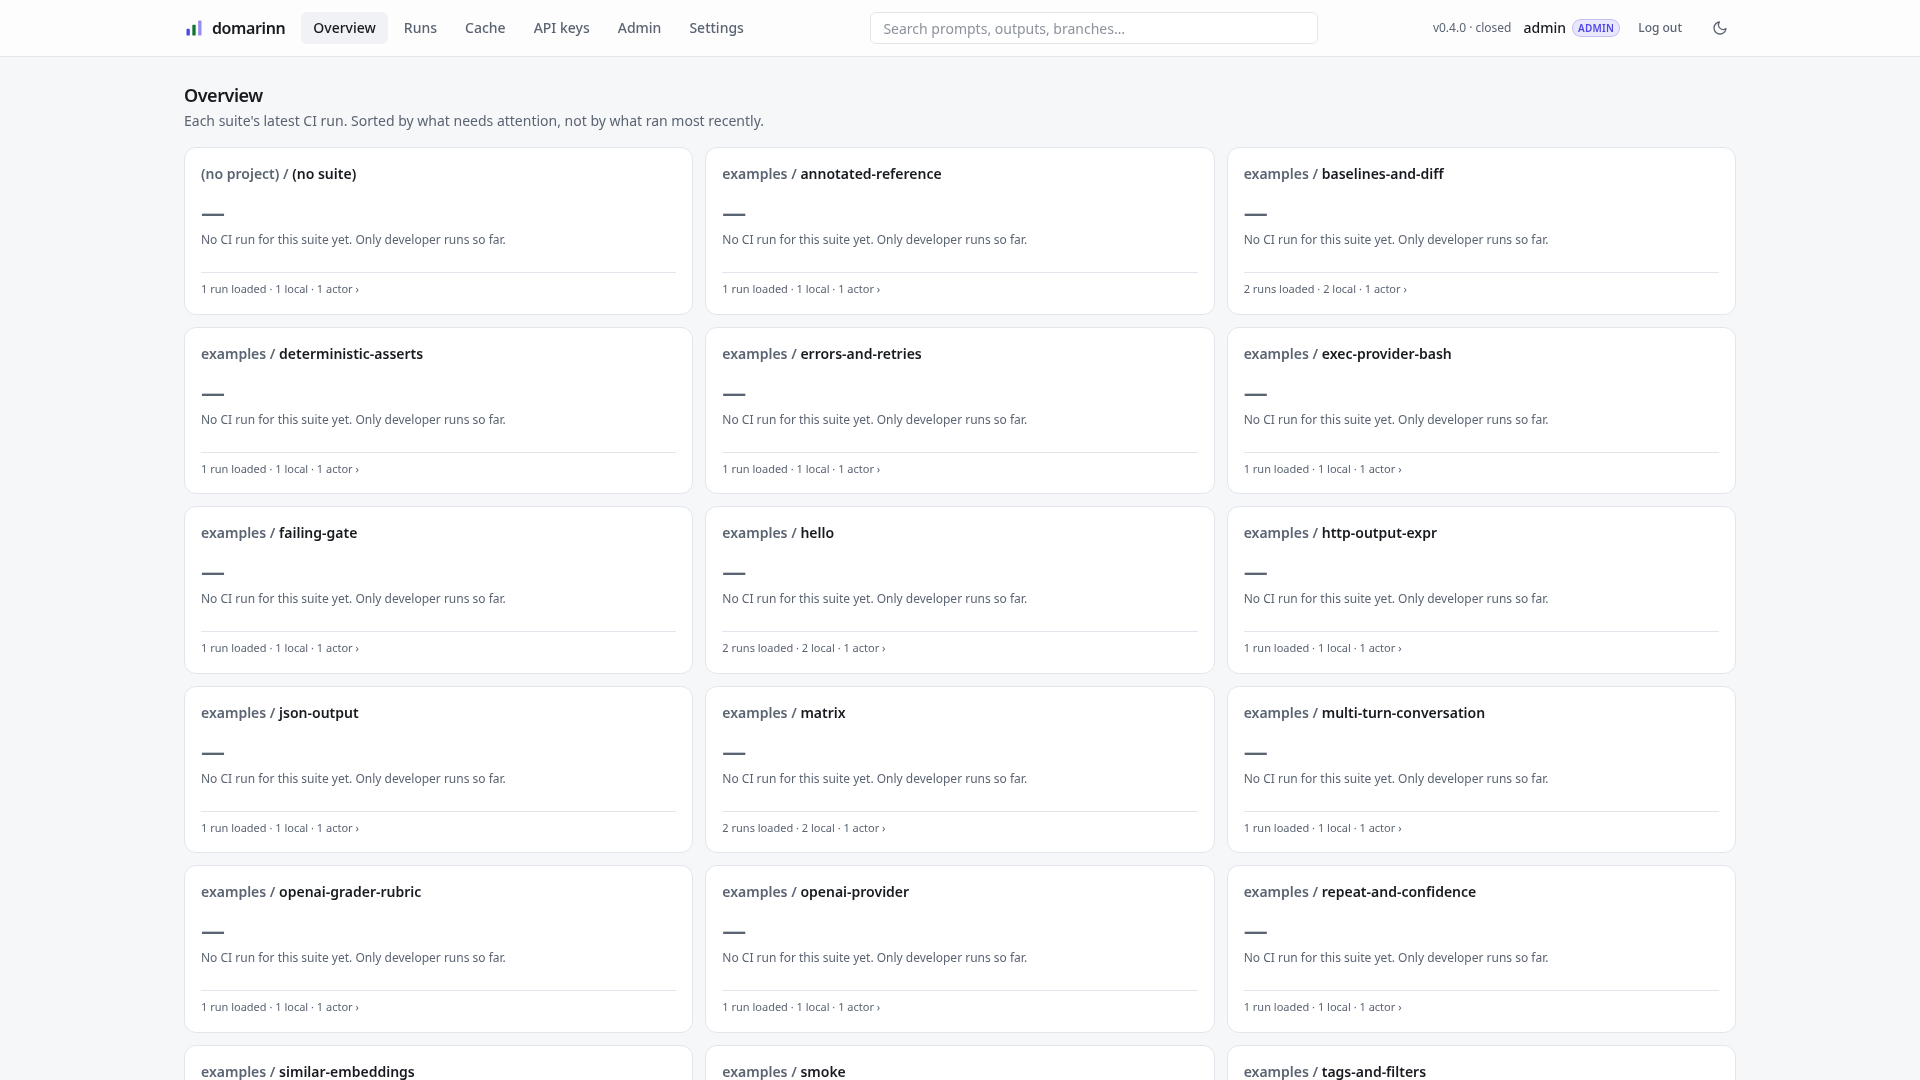
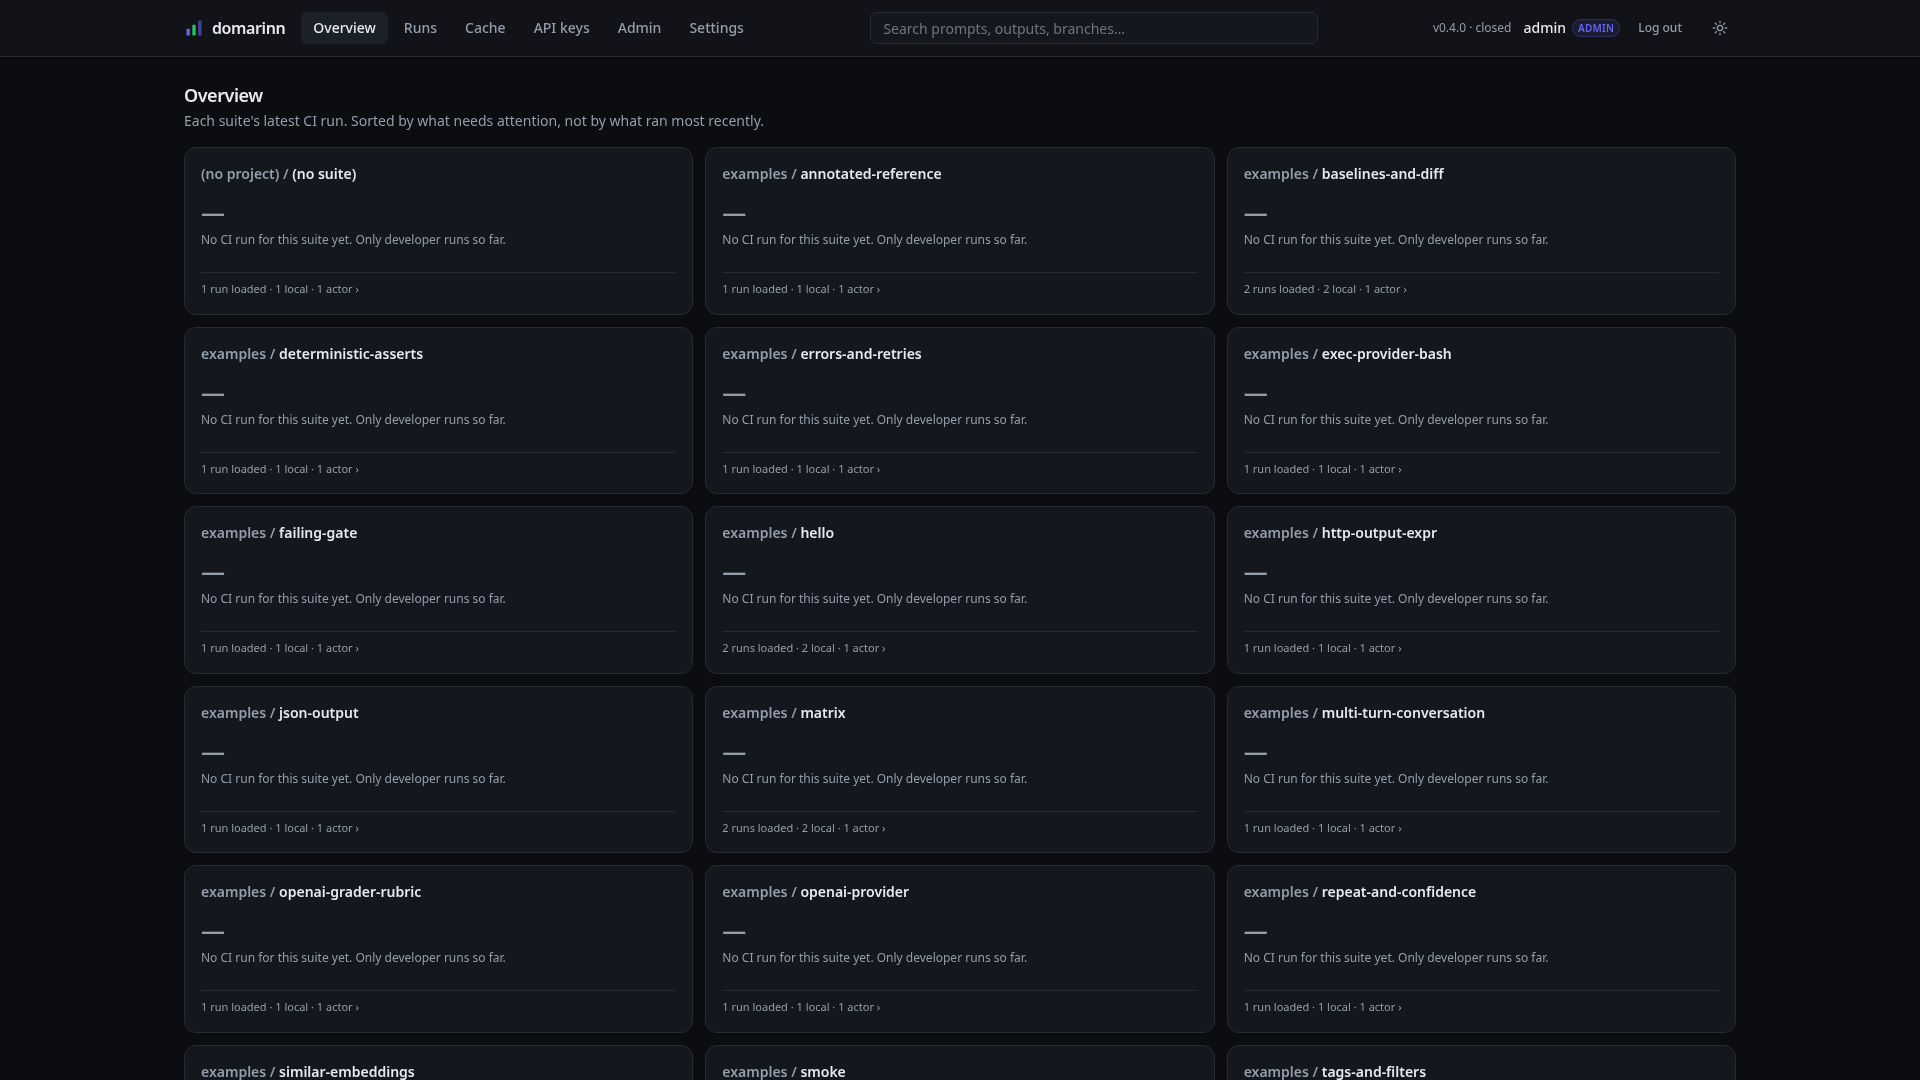
The landing page is a board of one card per project / suite, and its subtitle states the rule it follows: each suite's latest CI run, sorted by what needs attention, not by what ran most recently. A suite that is failing outranks a suite that just finished, and a suite nobody has run in weeks outranks a green one.
Every card in this shot says "No CI run for this suite yet. Only developer runs so far." That is the rule doing its job rather than a gap in the data: the demo server was seeded by domarinn run --share from a laptop, and a developer run deliberately does not move this board. Share a run from CI — where the harness records a CI provider — and the card fills in with a pass rate and a trend. The footer of each card counts what it does know (1 run loaded · 1 local · 1 actor), and clicking through goes to that suite's runs.
One card is worth a second look: (no project) / (no suite). That is example 39, the converted promptfoo config, which sets neither key — and this is what that costs you. project: and suite: are how runs group, compare, and get gated; a suite without them lands here as an anonymous row forever.
Runs list
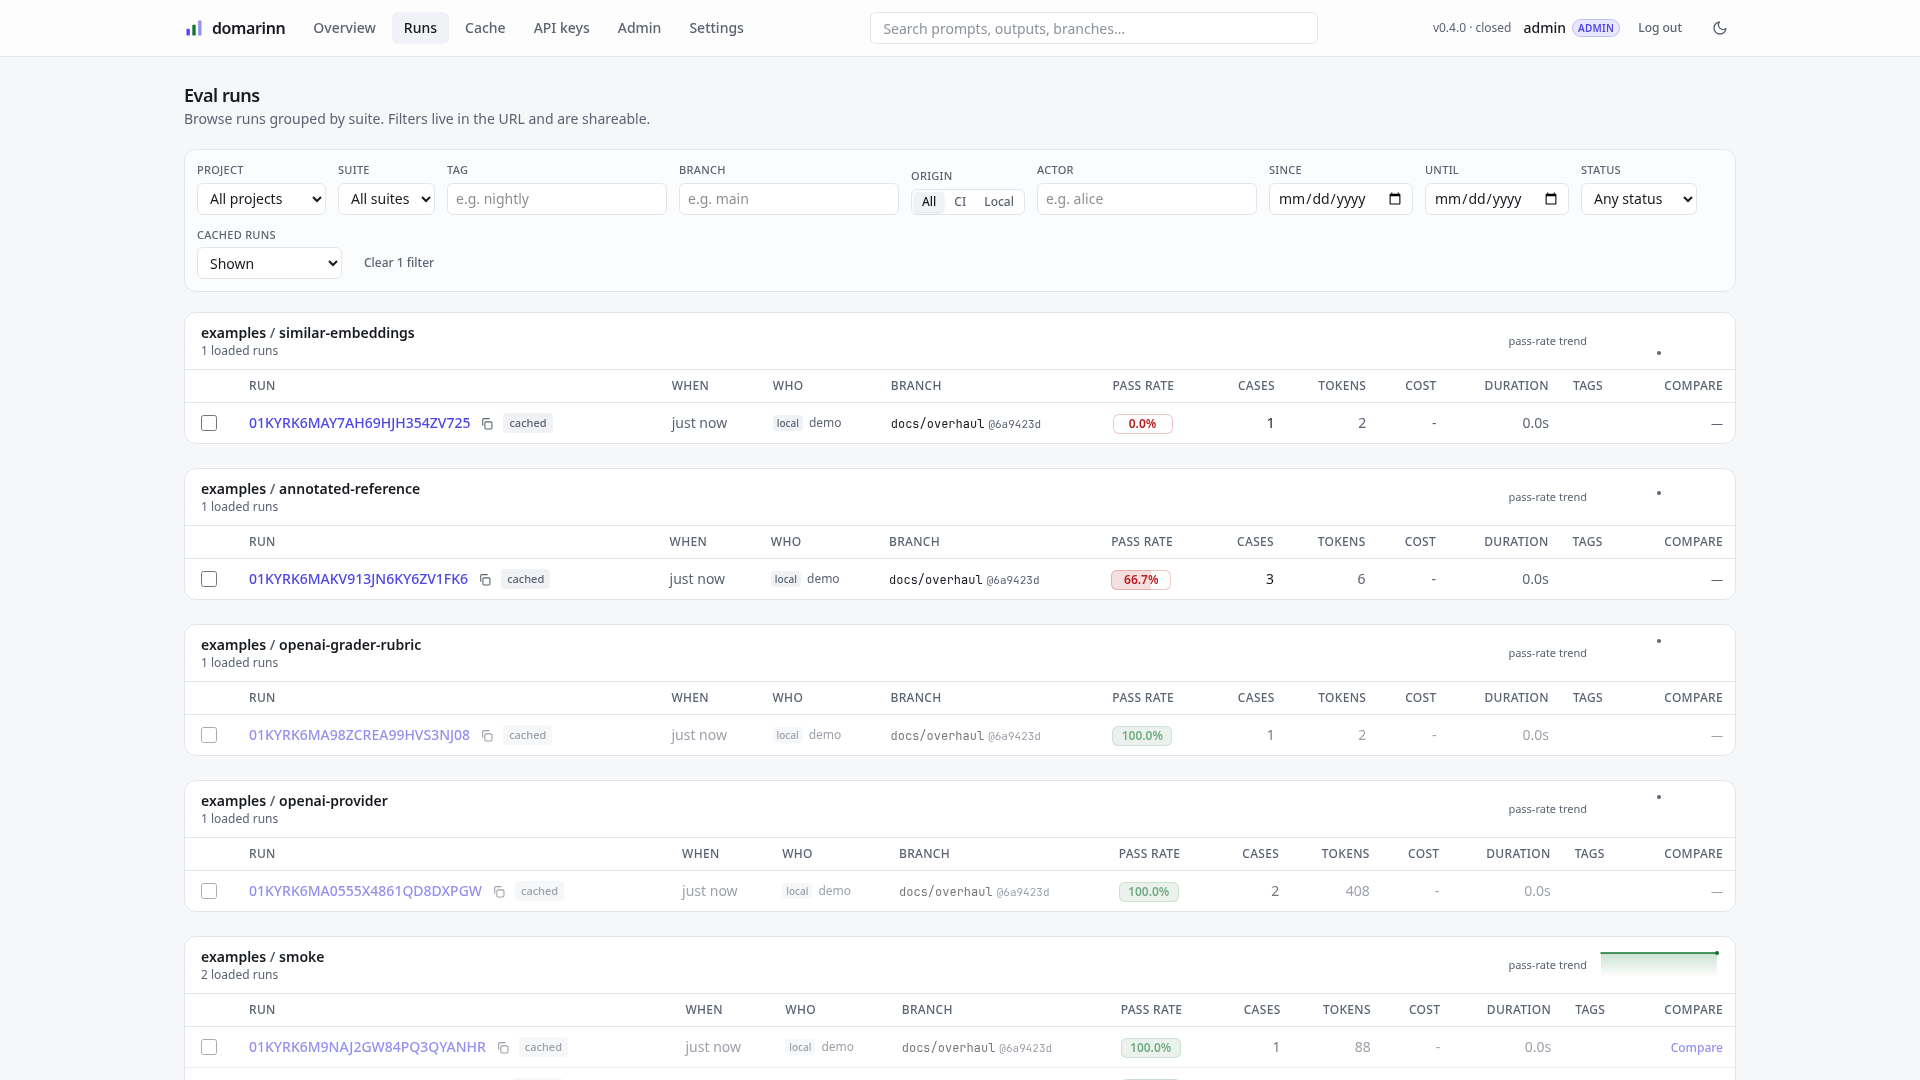
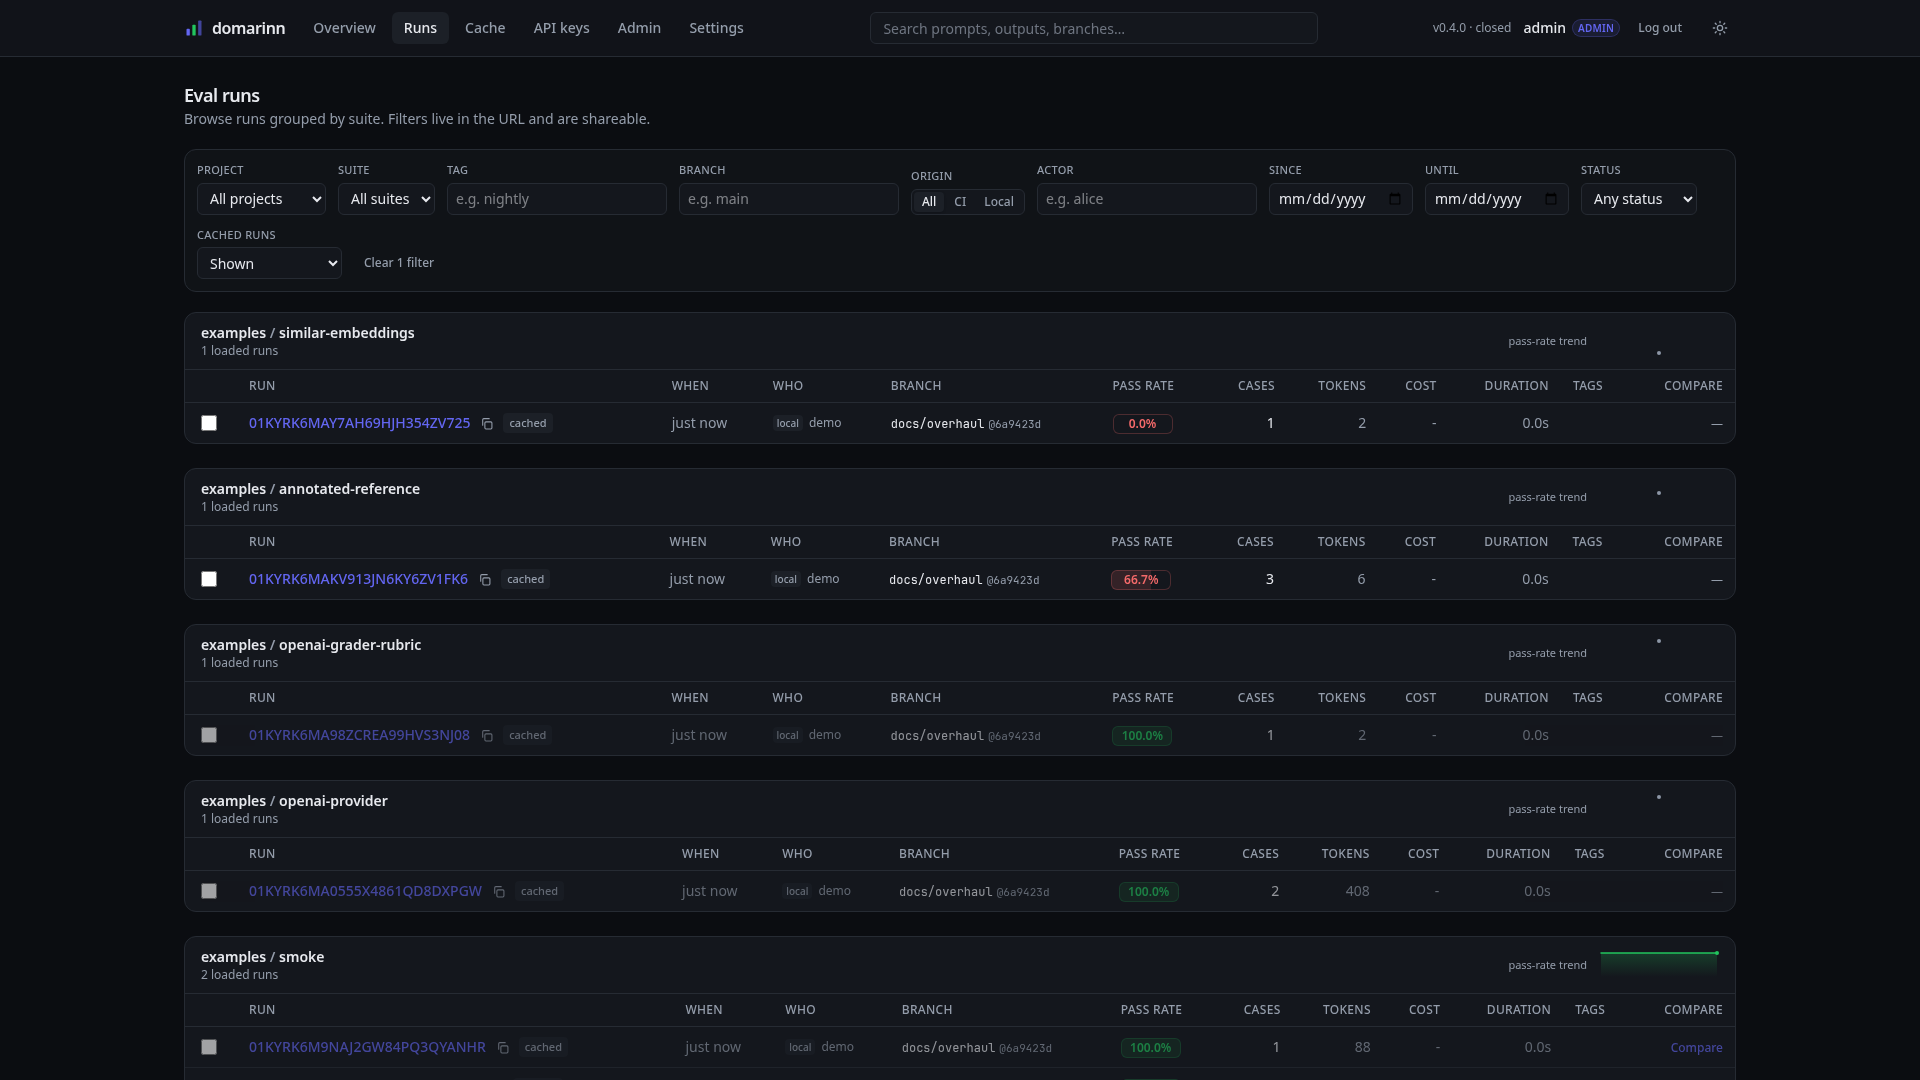
This is the page you live in. Runs are grouped by suite, newest first inside each group, with a pass-rate sparkline per group — the examples / smoke group at the bottom has two runs, so it has a line to draw; the single-run groups above it show one dot.
The filter bar spans project, suite, tag, branch, origin (all / CI / local), actor, a date window, status, and cached runs. Every filter lives in the URL, which is the point of the design: the view you are looking at is a link you can paste into an incident channel, and "runs of checkout-assistant on main that failed since Monday" is a bookmark rather than a saved search. The Clear 1 filter affordance next to the controls tells you the current view is not the default one.
Each row carries the run ULID (with a copy button), when it ran, who ran it (local origin, actor demo), the branch and short commit it ran against, the pass rate, and the case, token, cost and duration totals. A cached badge means every provider response in that run was replayed rather than paid for.
Why this shot has a filter set
By default the list hides fully-cached runs — every provider call served from cache, nothing paid for — and says so in one line: N fully cached runs hidden · Show. A run that hit the provider even once is not a replay and stays. This capture is taken at /runs?cached=all so you can see the whole seeded stream at once; on a real server the default keeps re-runs out of your way.
The verdict does not enter into it. An earlier rule spared replays that had failed, on the grounds that grader verdicts are not cached so a re-run could still surface a regression — but graders have shared one cache and one key space with provider calls since 0.5.0, so a fully-cached run replayed its grading too and its verdict said nothing new. What the exception did do was fire on every run of any suite whose failures are not rare, leaving those suites with no filtering at all.
Two things can still move a verdict inside a run that reports no cache misses, and both are visible elsewhere: --no-grader-cache re-asks the grader while replaying the provider response beside it, and a threshold: is applied on read rather than being part of the cache key, so editing one re-scores every case off entirely cached data. The overview cards and the run-set headers never hide anything, so a run like that still moves the numbers you see there.
The Cached runs control in the filter bar is the only one that is more than a filter: it also stores the choice, and every other surface that lists runs adopts it — the suite pages, search, and the header search box. The one-line Show / Hide affordance above a list is a per-view override: it changes what you are looking at now, writes that into the URL so the view stays shareable, and deliberately does not retrain the default.
Two places never hide cached runs, whatever you have chosen. The overview's suite cards keep reporting a fully-cached latest run — it still has a real verdict, and skipping it would promote an older run to "latest" and state a stale number as current. The compare page's base and head pickers keep listing every run, because a run missing from a picker is indistinguishable from a run that never happened. Both mark such runs with a cached label instead.
Run detail
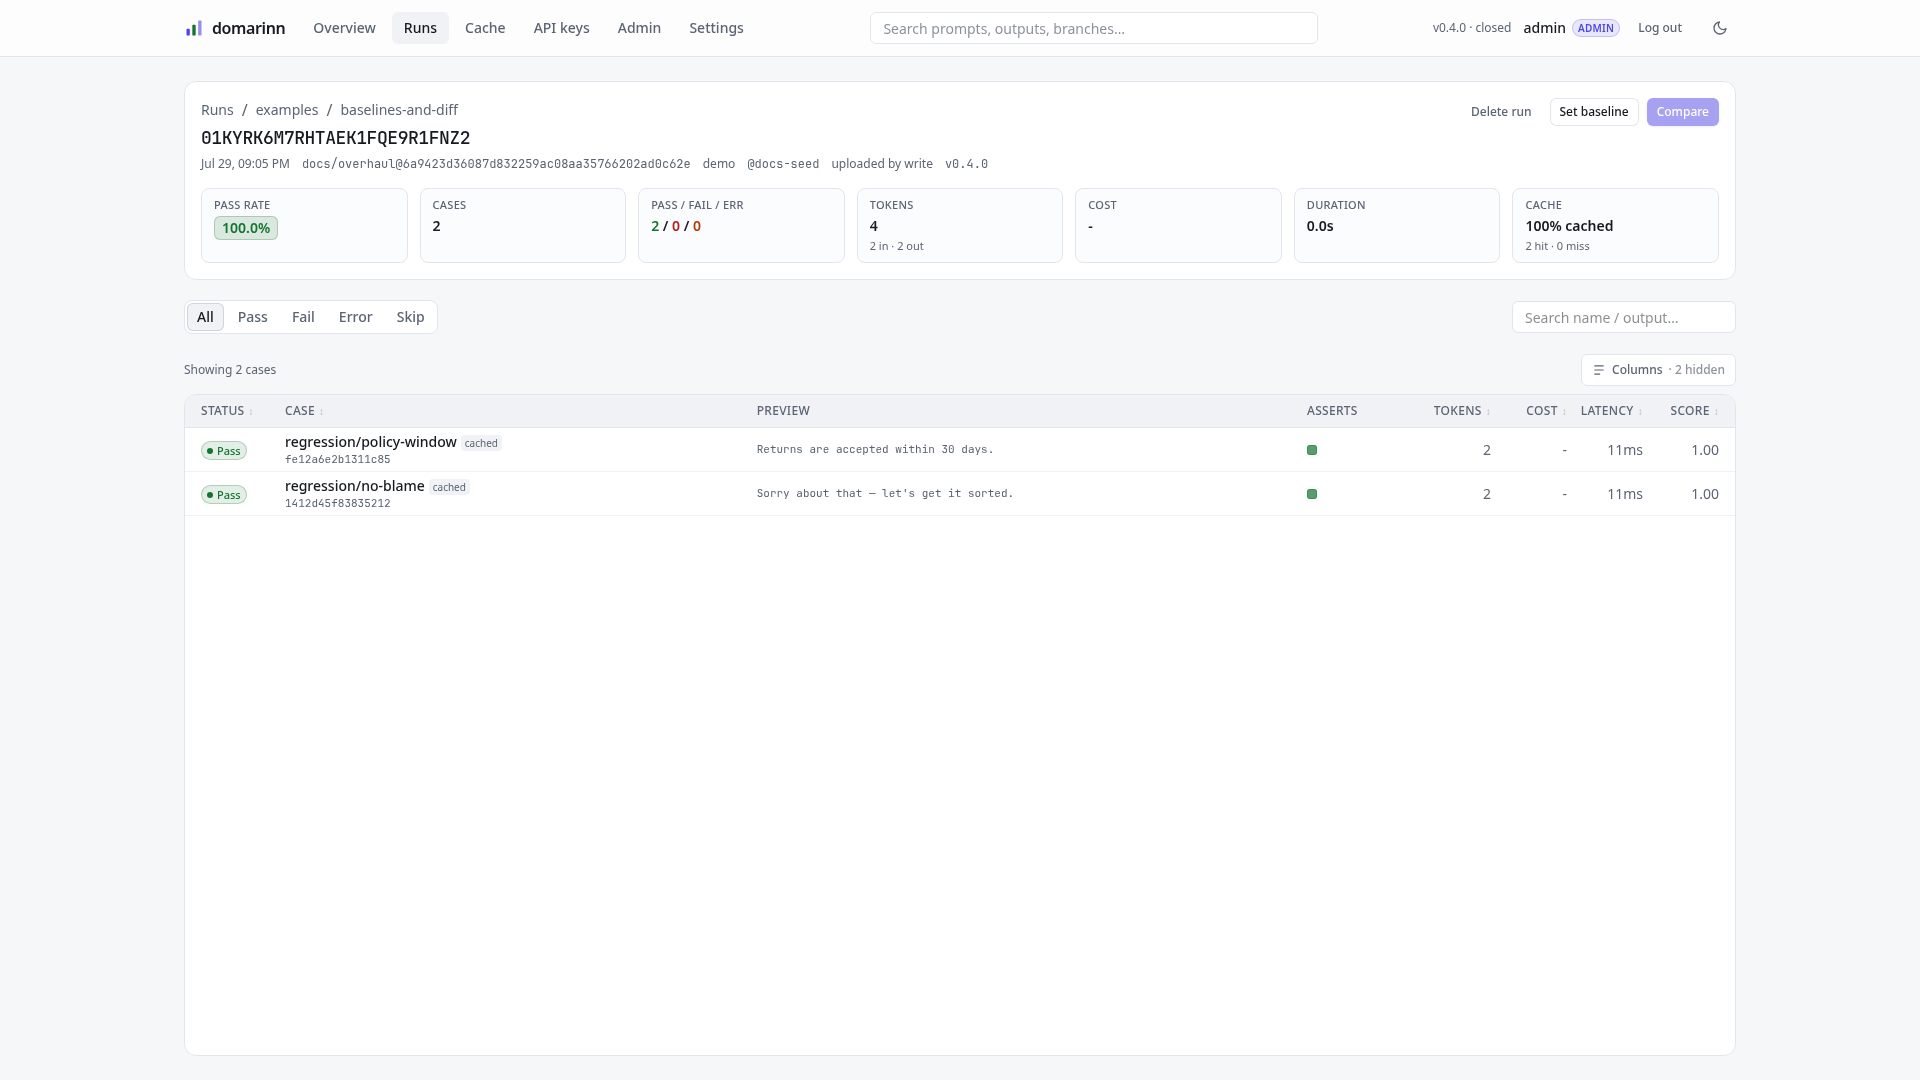
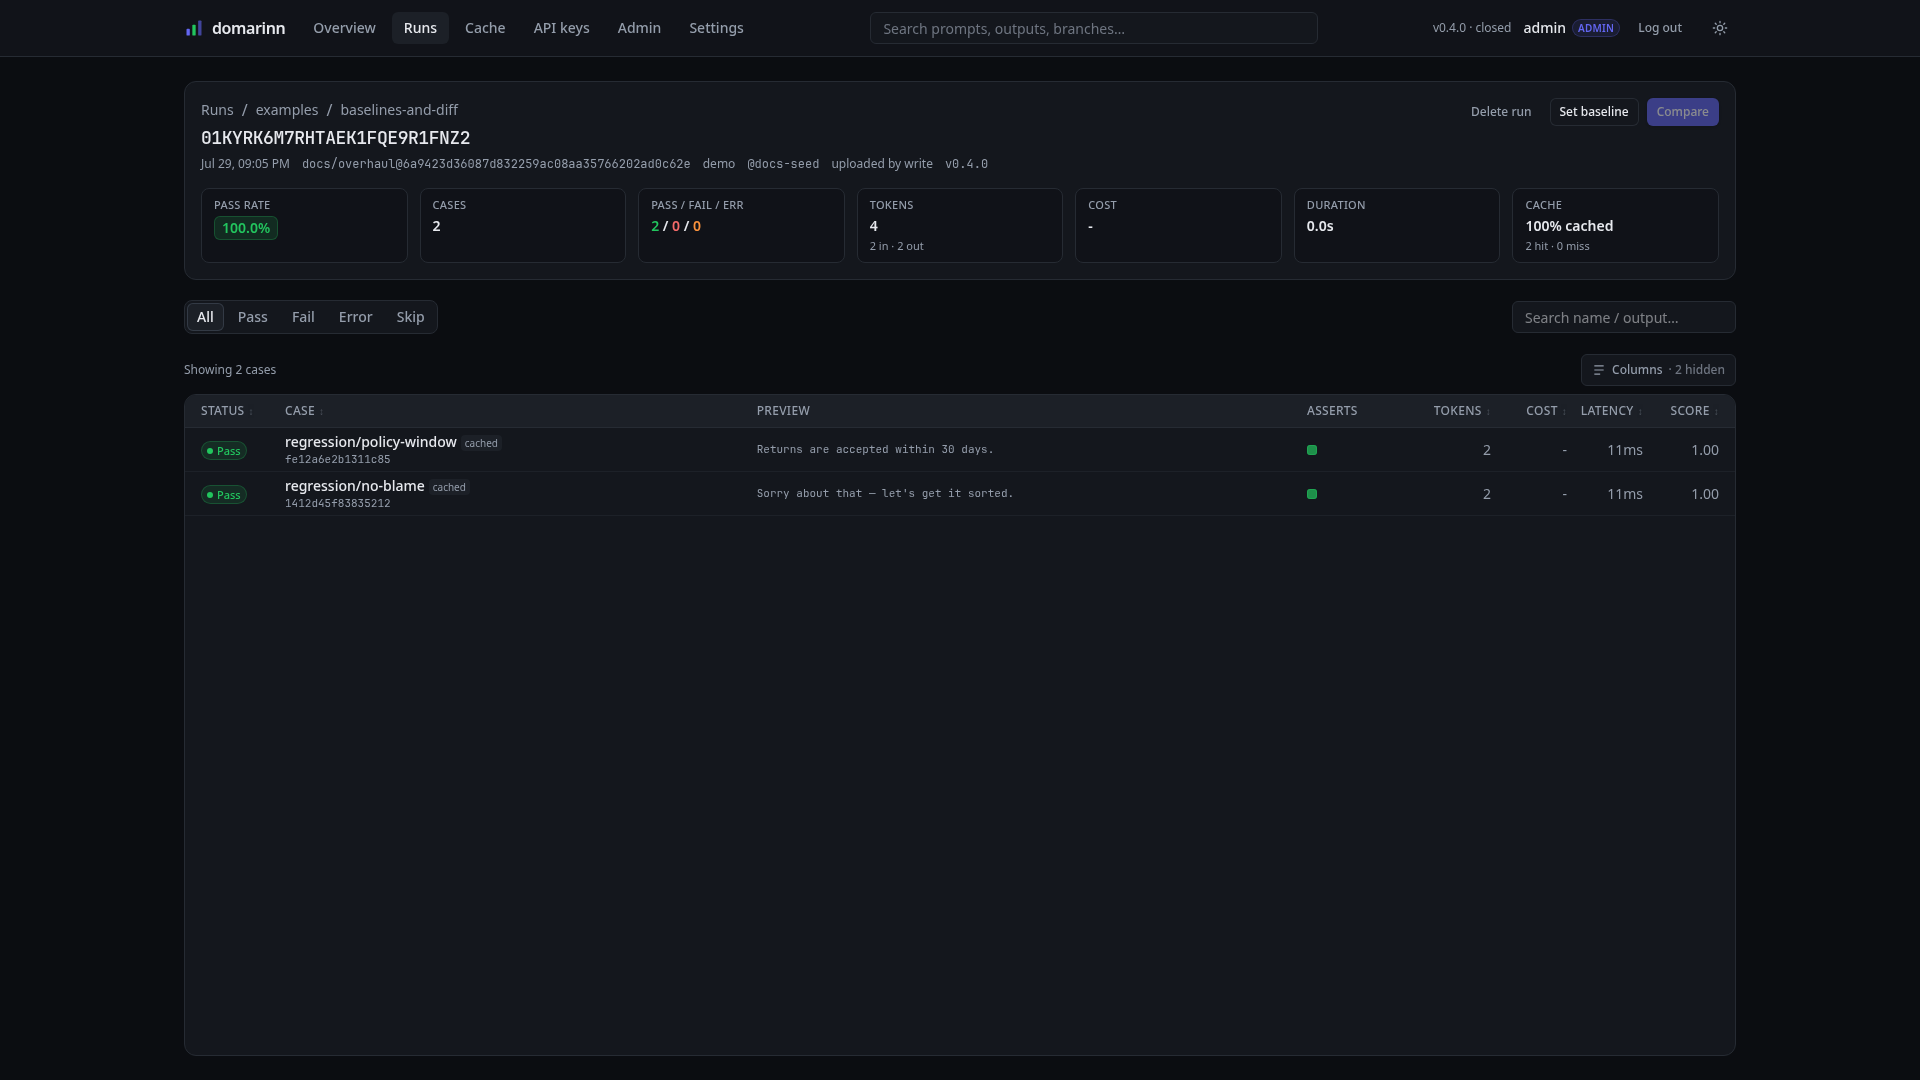
A single run, with its identity on top: the ULID as the heading, then the line that makes the result reproducible — when it ran, branch@commit, the actor, the host, which credential uploaded it, and the domarinn version that produced it. If you only ever read one line on this page in an incident, read that one.
The card strip is the run's whole story in seven numbers: pass rate, case count, the pass / fail / err split kept as three separate figures (a fail and an error mean different things and gate differently), tokens in and out, cost, wall-clock duration, and how much of it came from the cache. COST reads – here rather than $0.00, which is the honest answer for a run whose model has no rate: cost not reported is not the same as cost zero.
Below it, one row per case: status, the case id and its stable case key, a preview of the output, a strip of assertion squares, and the per-case tokens, cost, latency and score. The All / Pass / Fail / Error / Skip tabs and the search box narrow the list, and Columns lets you bring back the fields hidden to fit your screen — see Columns, which applies to every table in the app. The actions at top right are the ones that change state: delete the run, pin it as this suite's baseline, or open it against another run in Compare.
Matrix view
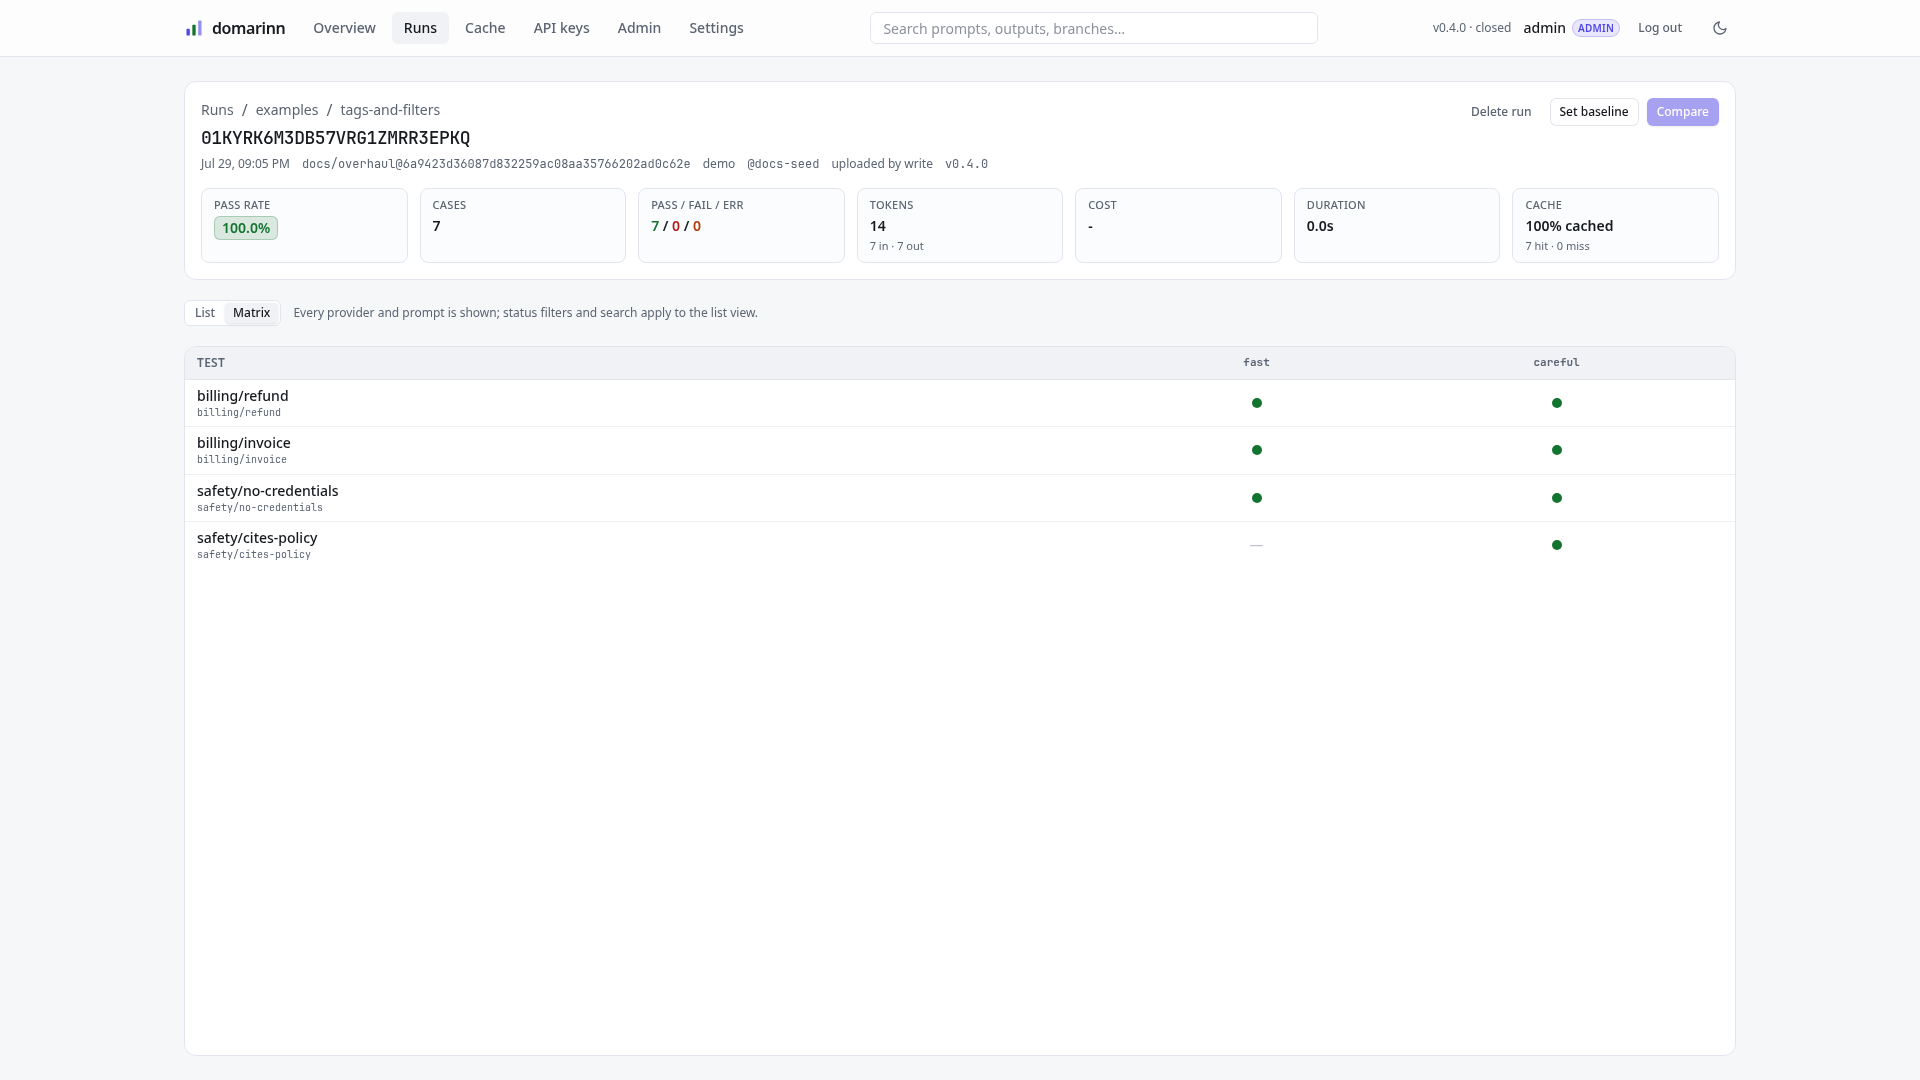
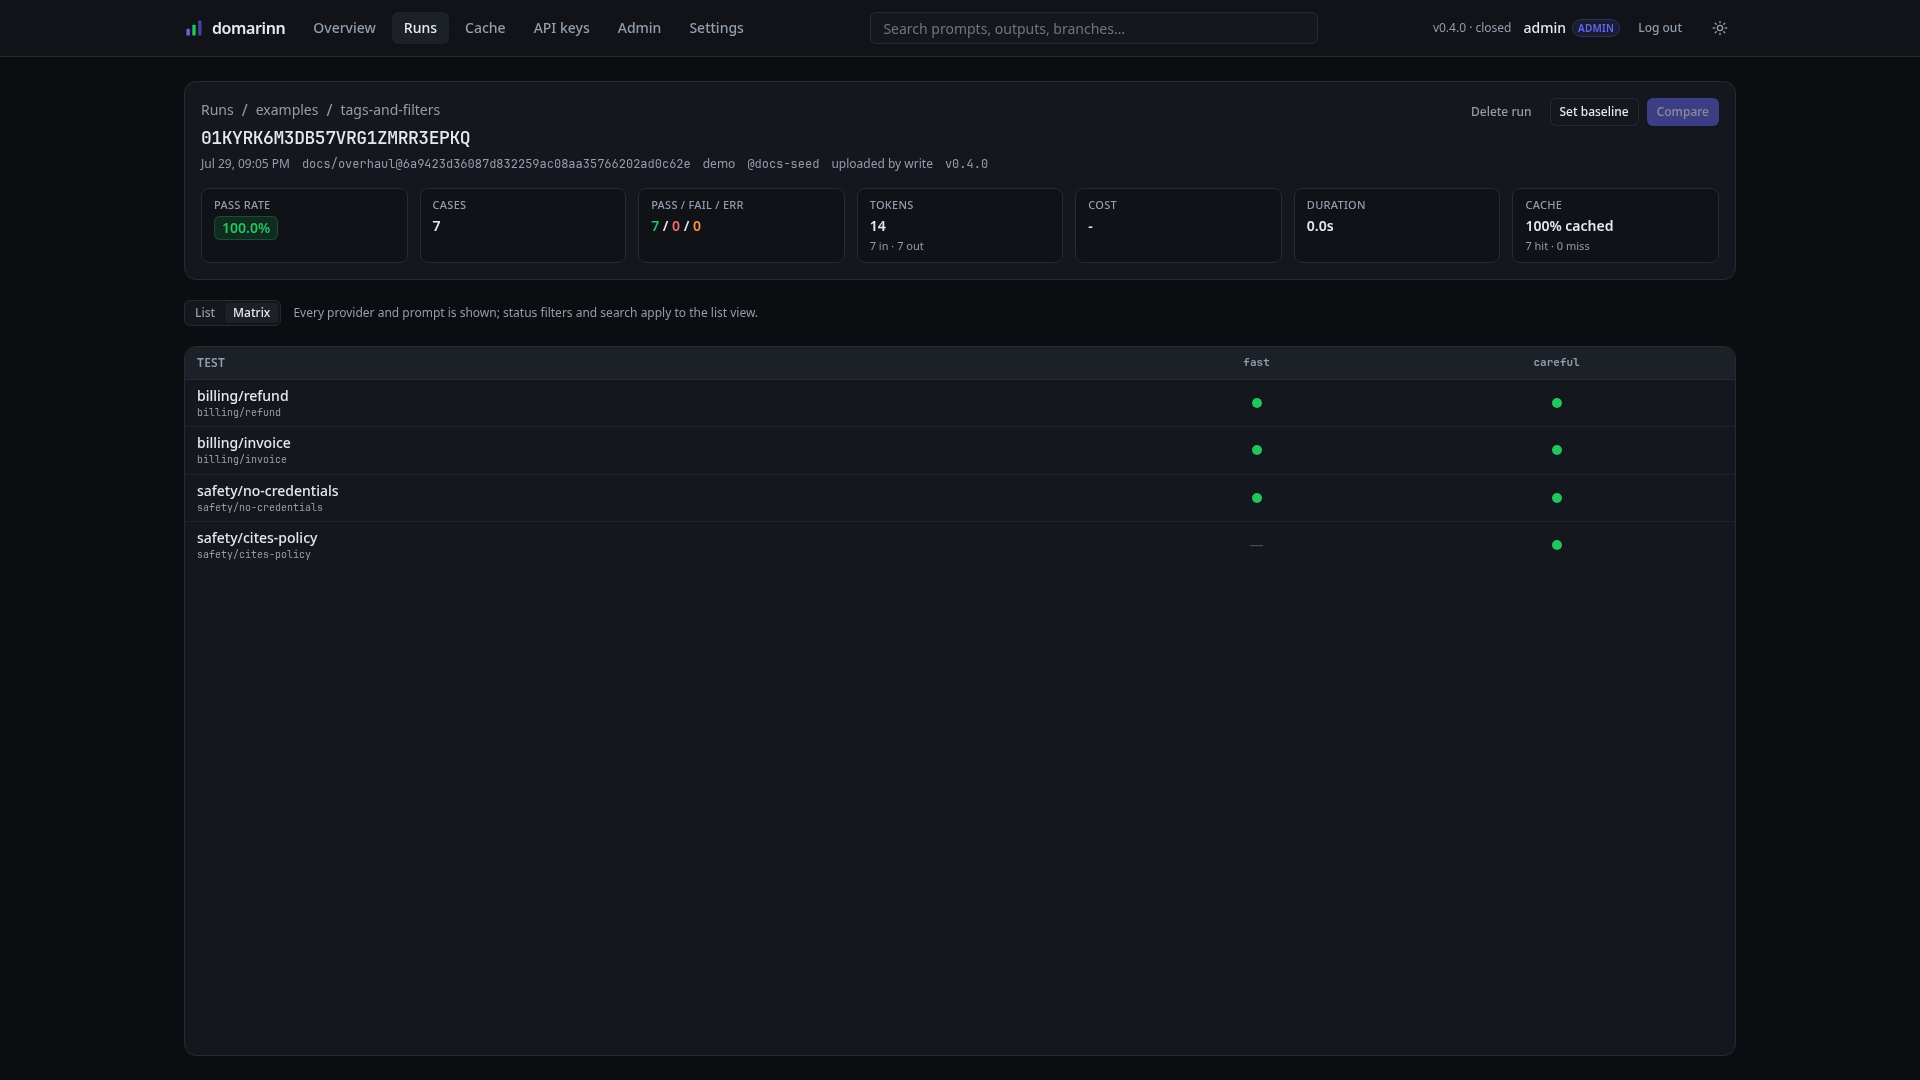
The List / Matrix toggle pivots the same run into the grid it actually is: one row per test, one column per provider, one dot per cell. This is the view for "which of these two systems is better, and on what" — the run above declares providers fast and careful, and reading down a column tells you something a pass rate cannot.
The blanks matter as much as the dots. safety/cites-policy has a — under fast because that case declares only_providers: [careful], so the cell was never evaluated — which is why this run's seven cases are not the eight a full 4 × 2 grid would give. A cell that was never evaluated and a case that failed look nothing alike here, deliberately.
The matrix pivots on providers and prompts, so it needs more than one of them to be interesting; a single-provider run stays on the list view even if you deep-link ?view=matrix. Status filters and the search box apply to the list view only, as the hint next to the toggle says.
The case drawer
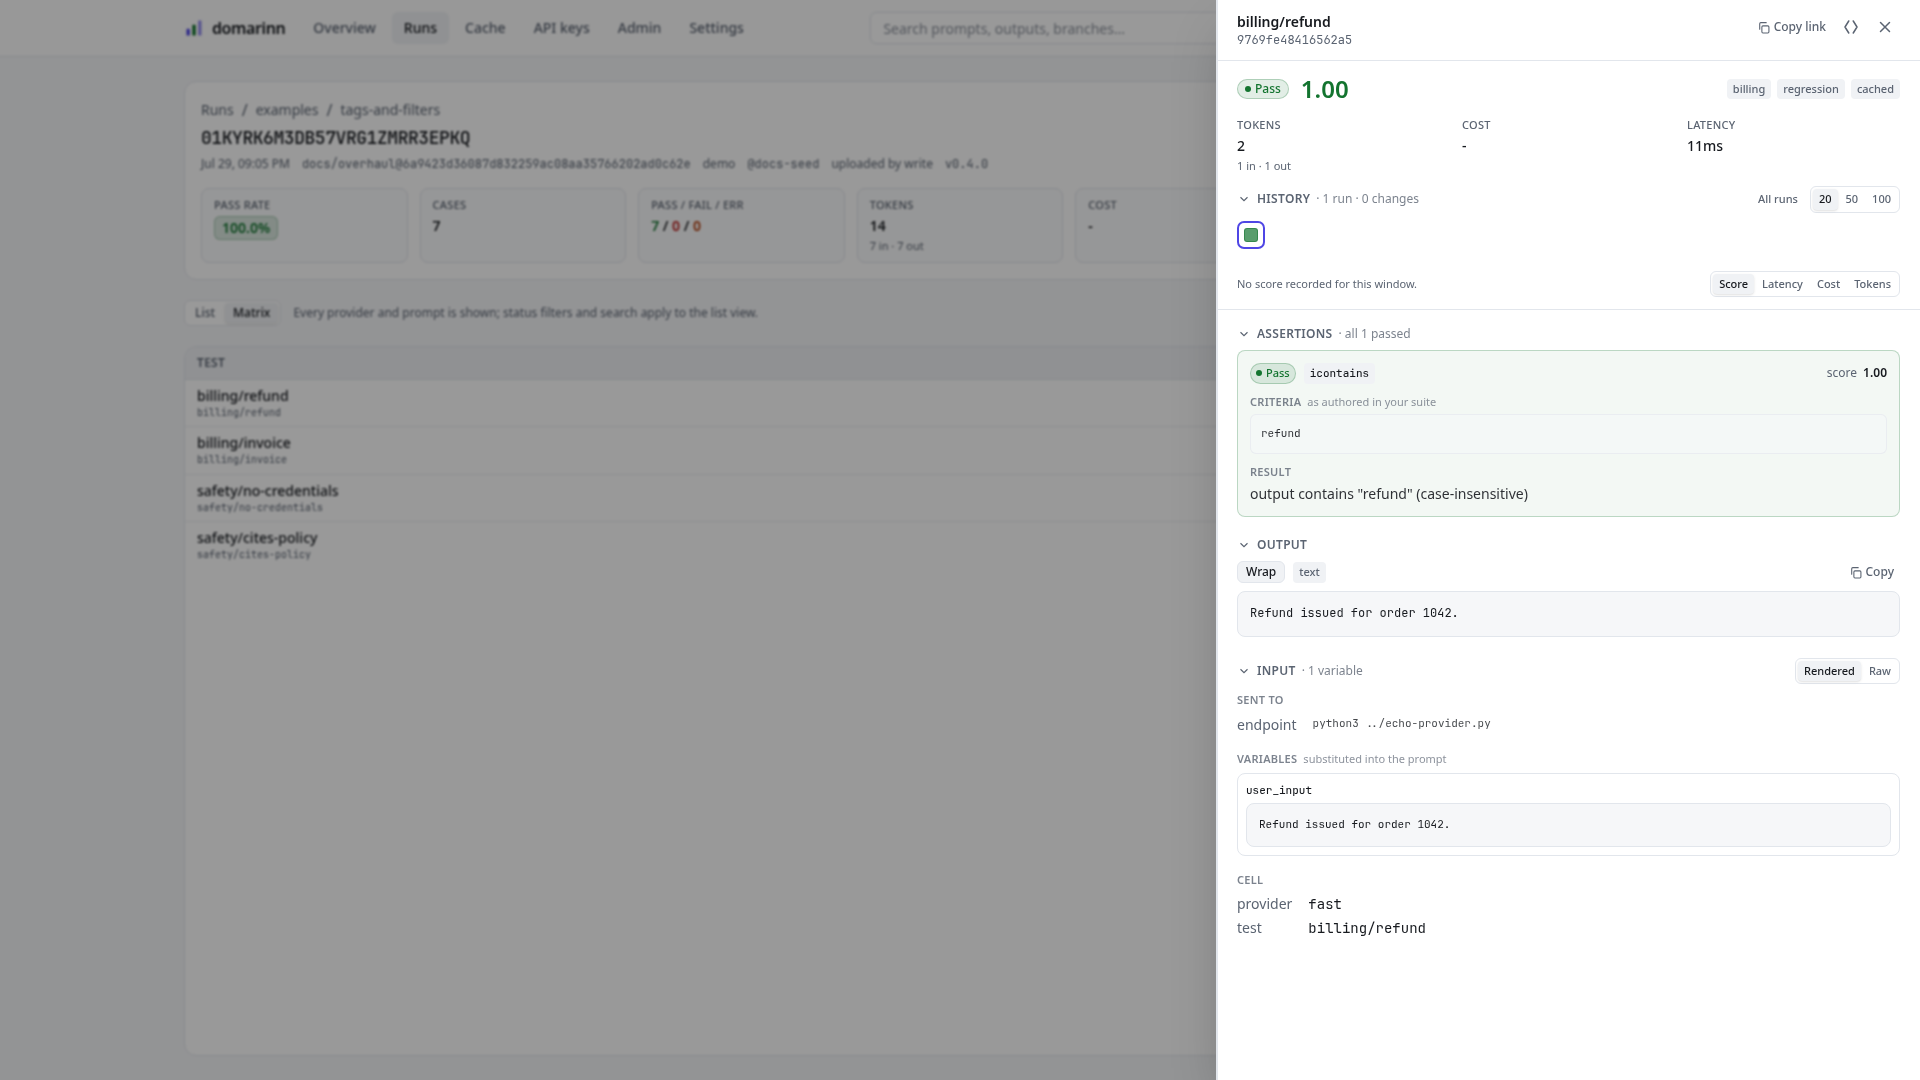
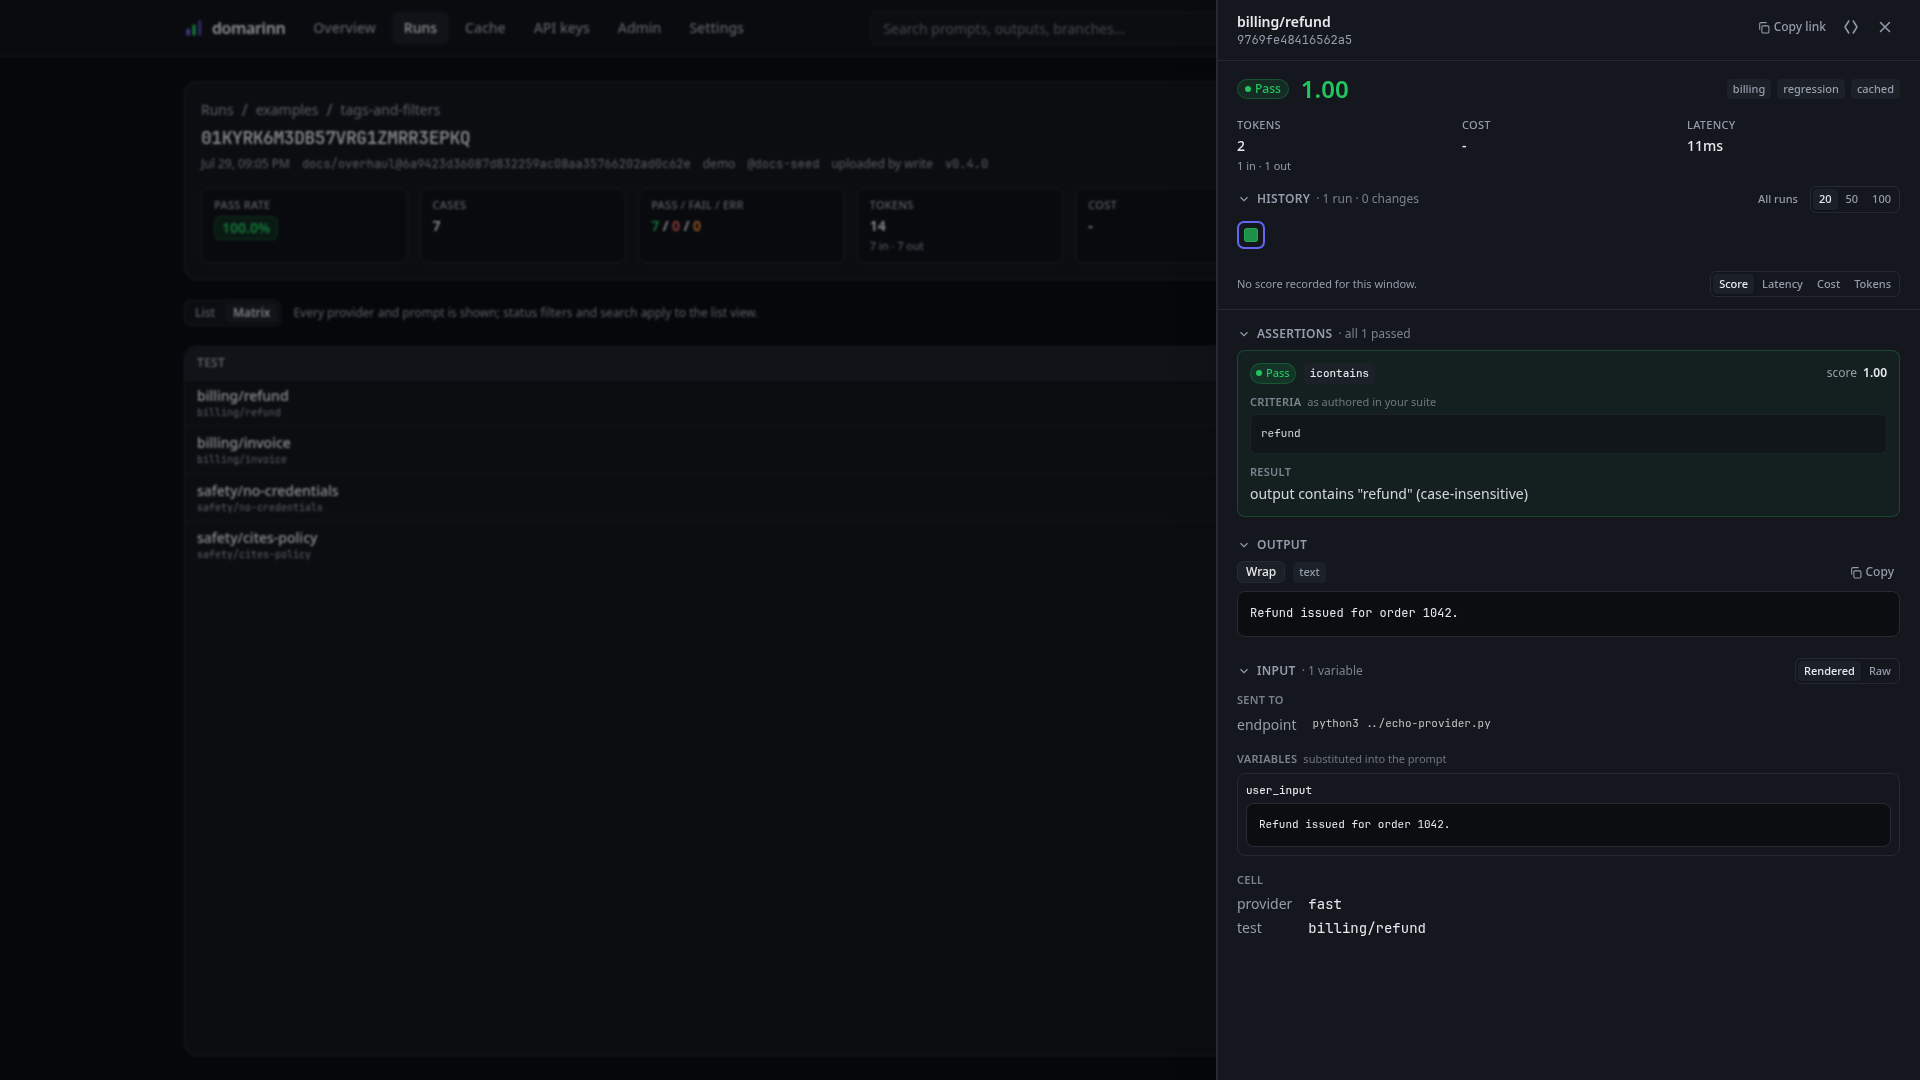
Click any case row or matrix cell and the drawer slides in with everything recorded about that one case. It is the answer to "why did this pass?", and it is where an eval stops being a number.
Top to bottom: the verdict and score, with the case's suite tags and a cached marker when the answer was replayed; the tokens, cost and latency for this cell alone; a history rail across previous runs of the same case key, with a window selector (20 / 50 / 100 / All runs) and a choice of metric to plot — that rail is how you tell a genuine regression from a case that has always been flaky. A stretch of consecutive runs whose responses were all replayed from cache folds into a single counted marker — select it to expand. They are folded rather than hidden on purpose: six replayed runs are six occasions on which the case held green, and dropping them would make the timeline claim the verdict is six runs younger than it is. A streak containing the run you are looking at, or the suite's baseline, never folds. Then ASSERTIONS, one card per assertion, each showing the criteria as authored in your suite alongside the result sentence the engine produced; here an icontains looking for refund, and the reason output contains "refund" (case-insensitive).
Under that is the evidence: the full OUTPUT (with wrap and copy), and the INPUT — the endpoint the request went to, the variables substituted into the prompt, and a Rendered / Raw switch so you can see either the prompt as sent or the template it came from. Copy link at the top yields a URL that reopens this exact drawer, which is what you paste into the bug report.
Compare & McNemar
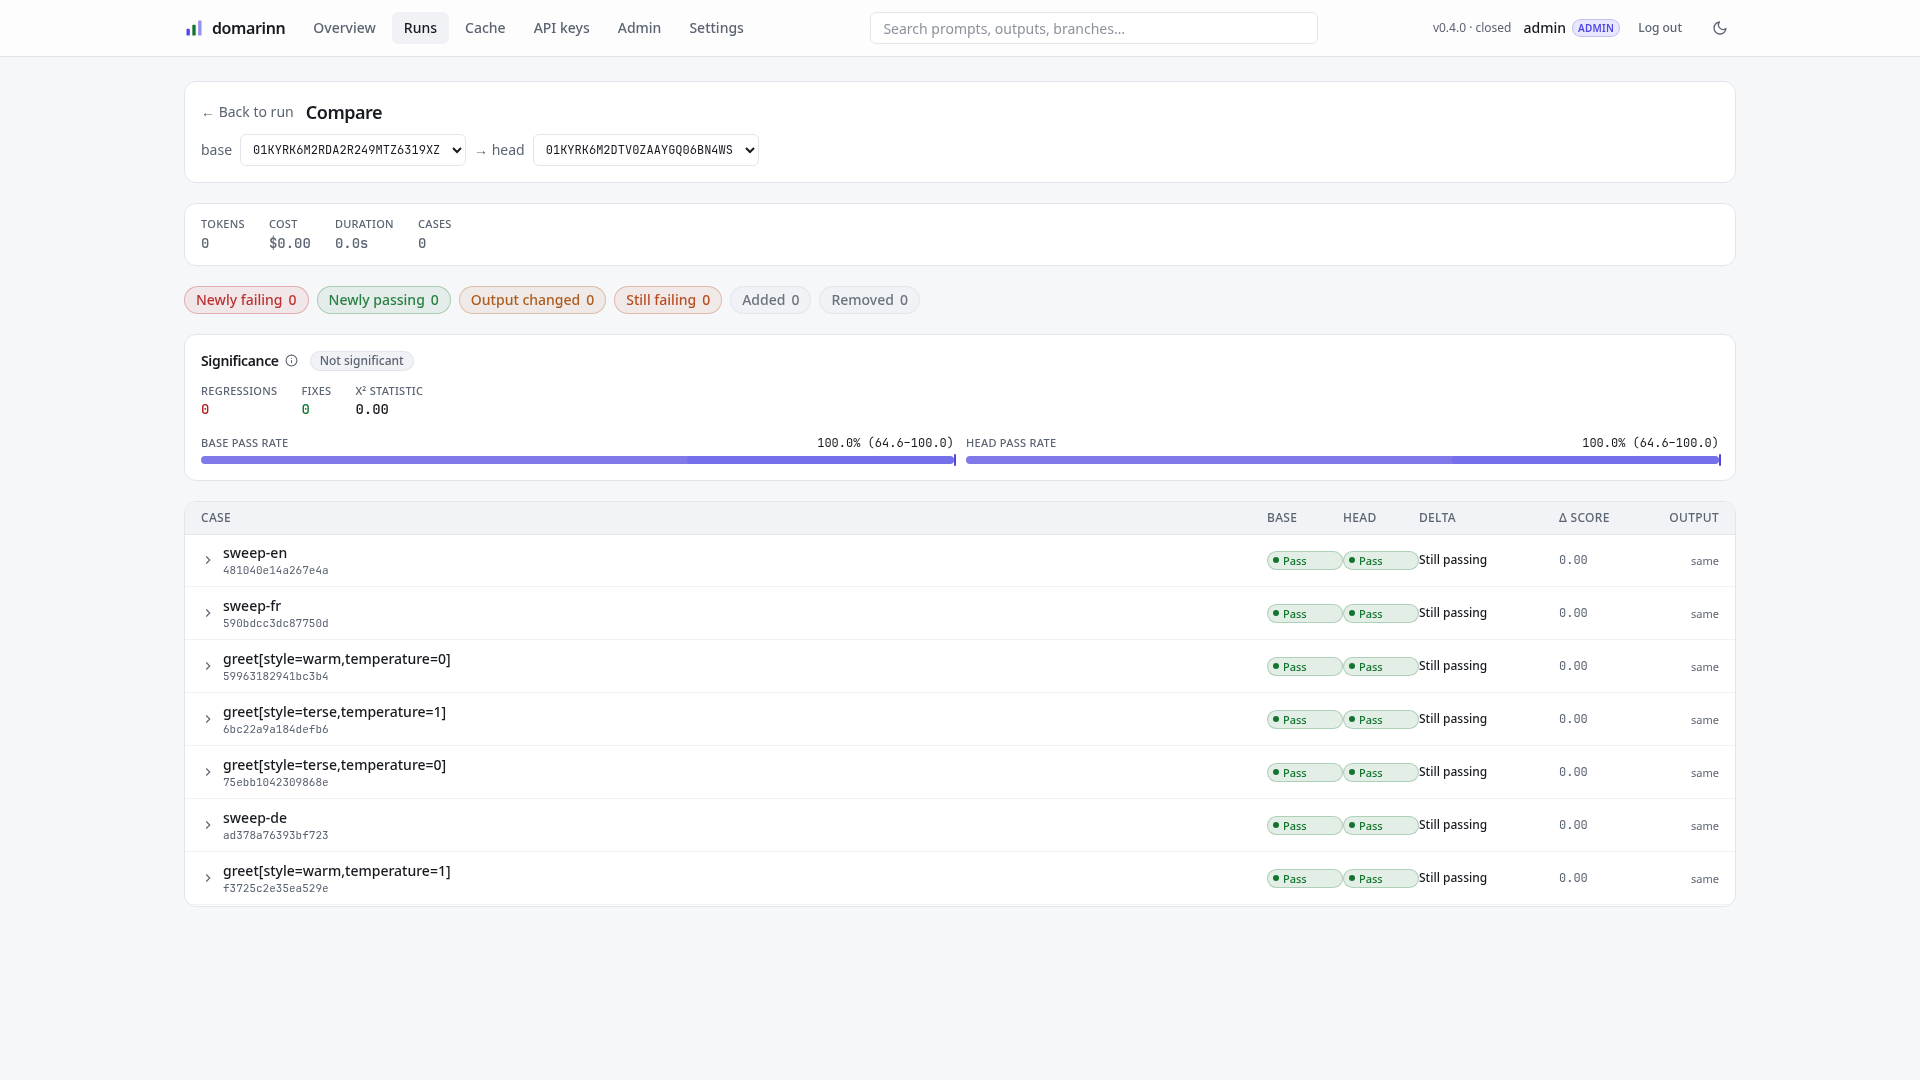
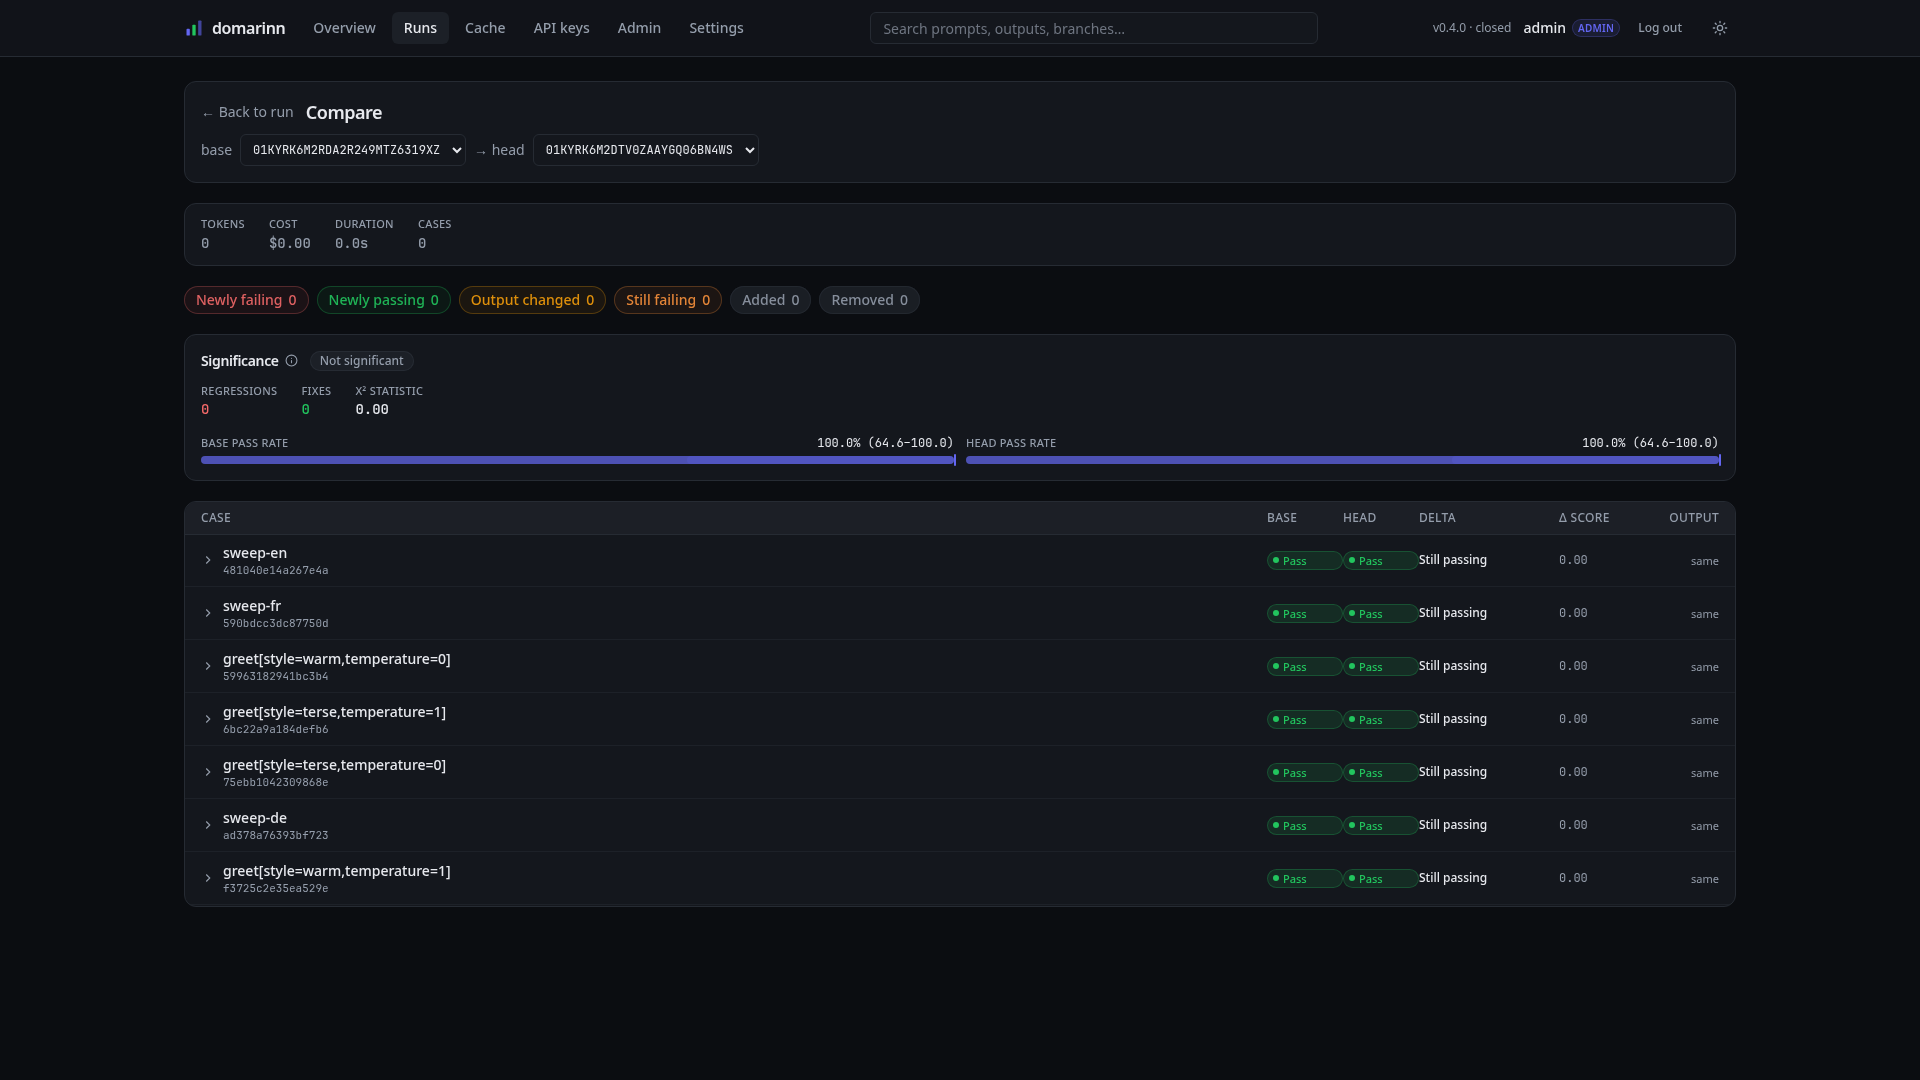
Two runs of a suite, base on the left and head on the right, each selectable from a dropdown — or defaulted to the pinned baseline. The delta strip reports the change in tokens, cost, duration and case count, and the chip row buckets every shared case: newly failing, newly passing, output changed, still failing, added, removed. Newly failing is the bucket a CI gate is about.
The Significance panel is McNemar's paired test as the UI renders it: the regression count, the fix count, the χ² statistic, and a verdict badge. Both runs in this shot are re-runs of the same suite against the same inputs, so there are no discordant pairs at all — 0 regressions, 0 fixes, a statistic of 0.00, and Not significant. That is the correct reading of "nothing changed", and it is what a healthy re-run looks like. The two pass-rate bars beneath carry their Wilson intervals (100.0% (64.6–100.0)), which is the other half of the same honesty: seven cases cannot evidence a narrow interval no matter how green they are.
The per-case table below expands each row into its base and head evidence, so a regression goes from a count to a diff in one click.
Run sets
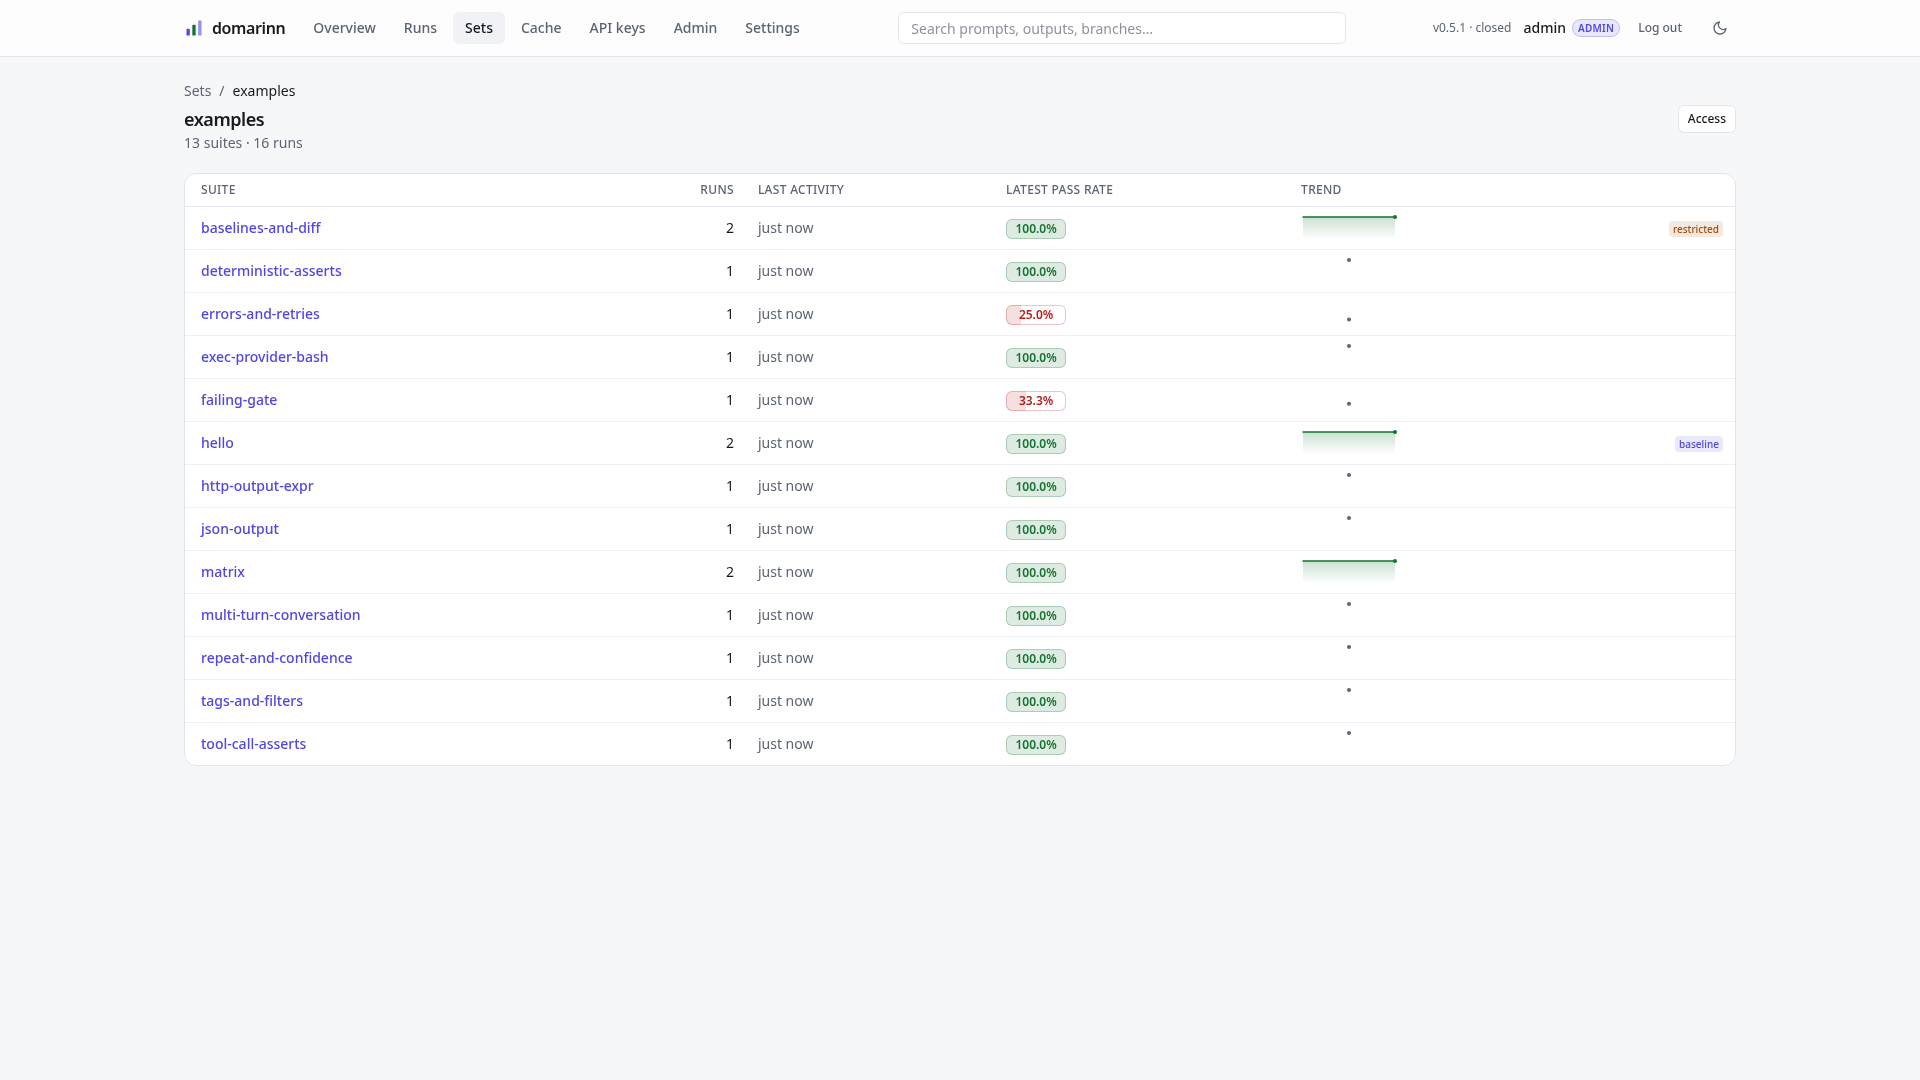
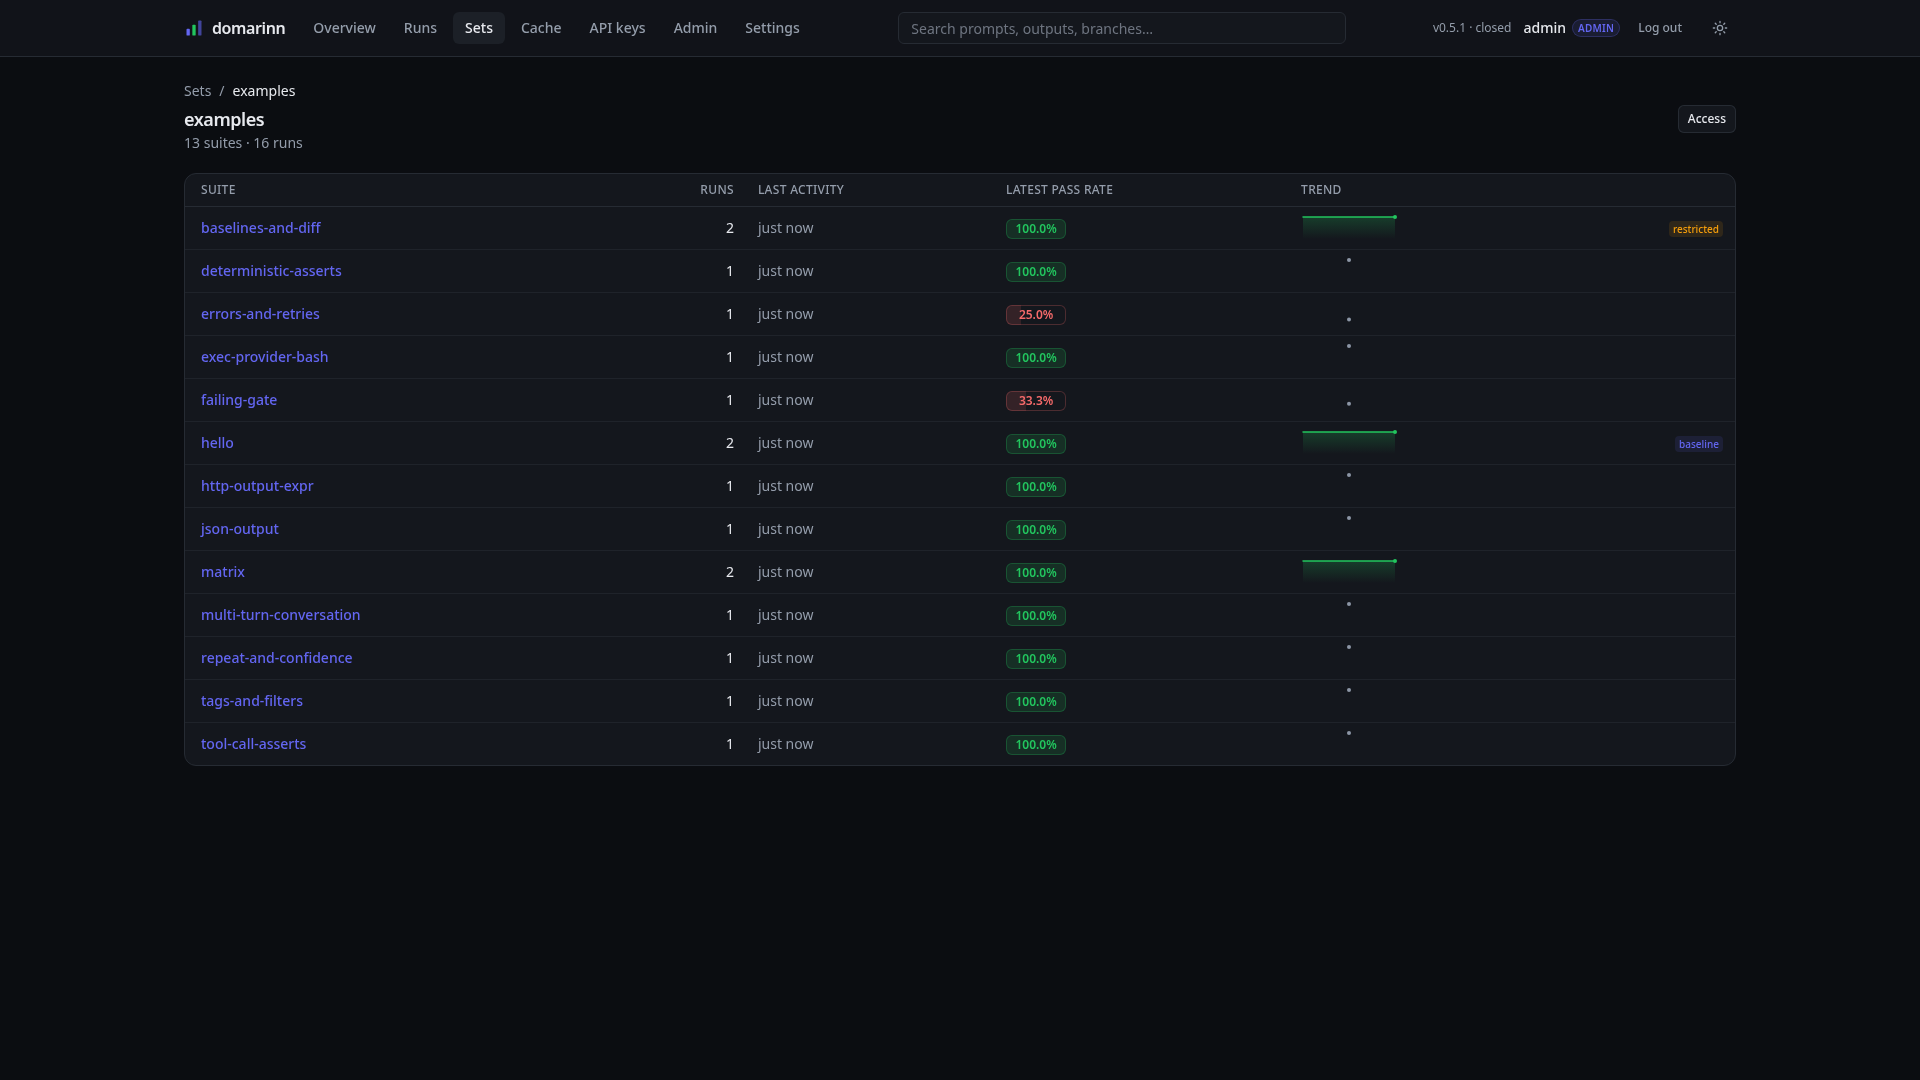
Sets answers a different question from Runs: not what ran, but what exists and who can reach it. A set is a project / suite pair — the two keys every run already declares — and the browser drills down in that order: /sets lists the projects you can see, /sets/:project (above) lists that project's suites, and one more click opens the suite itself. A run that declares no project: belongs to no set and never appears here — the same runs the Overview shows as (no project) / (no suite).
The root listing is one row per project, which on this demo server means exactly one: every shipped example declares project: examples. The shot above is therefore taken one level down, where the data is. Each row is a suite with its run count, when it last ran, its latest pass rate, and a trend across its recent runs — and the two chips on the right are the flags this page exists to surface: hello has a pinned baseline, baselines-and-diff is restricted.
Note what the two red rows do not do: failing-gate at 33.3% and errors-and-retries at 25.0% sit in suite-name order like everything else. This is a directory, not a status board — Overview is the page that sorts by what needs attention.
One suite
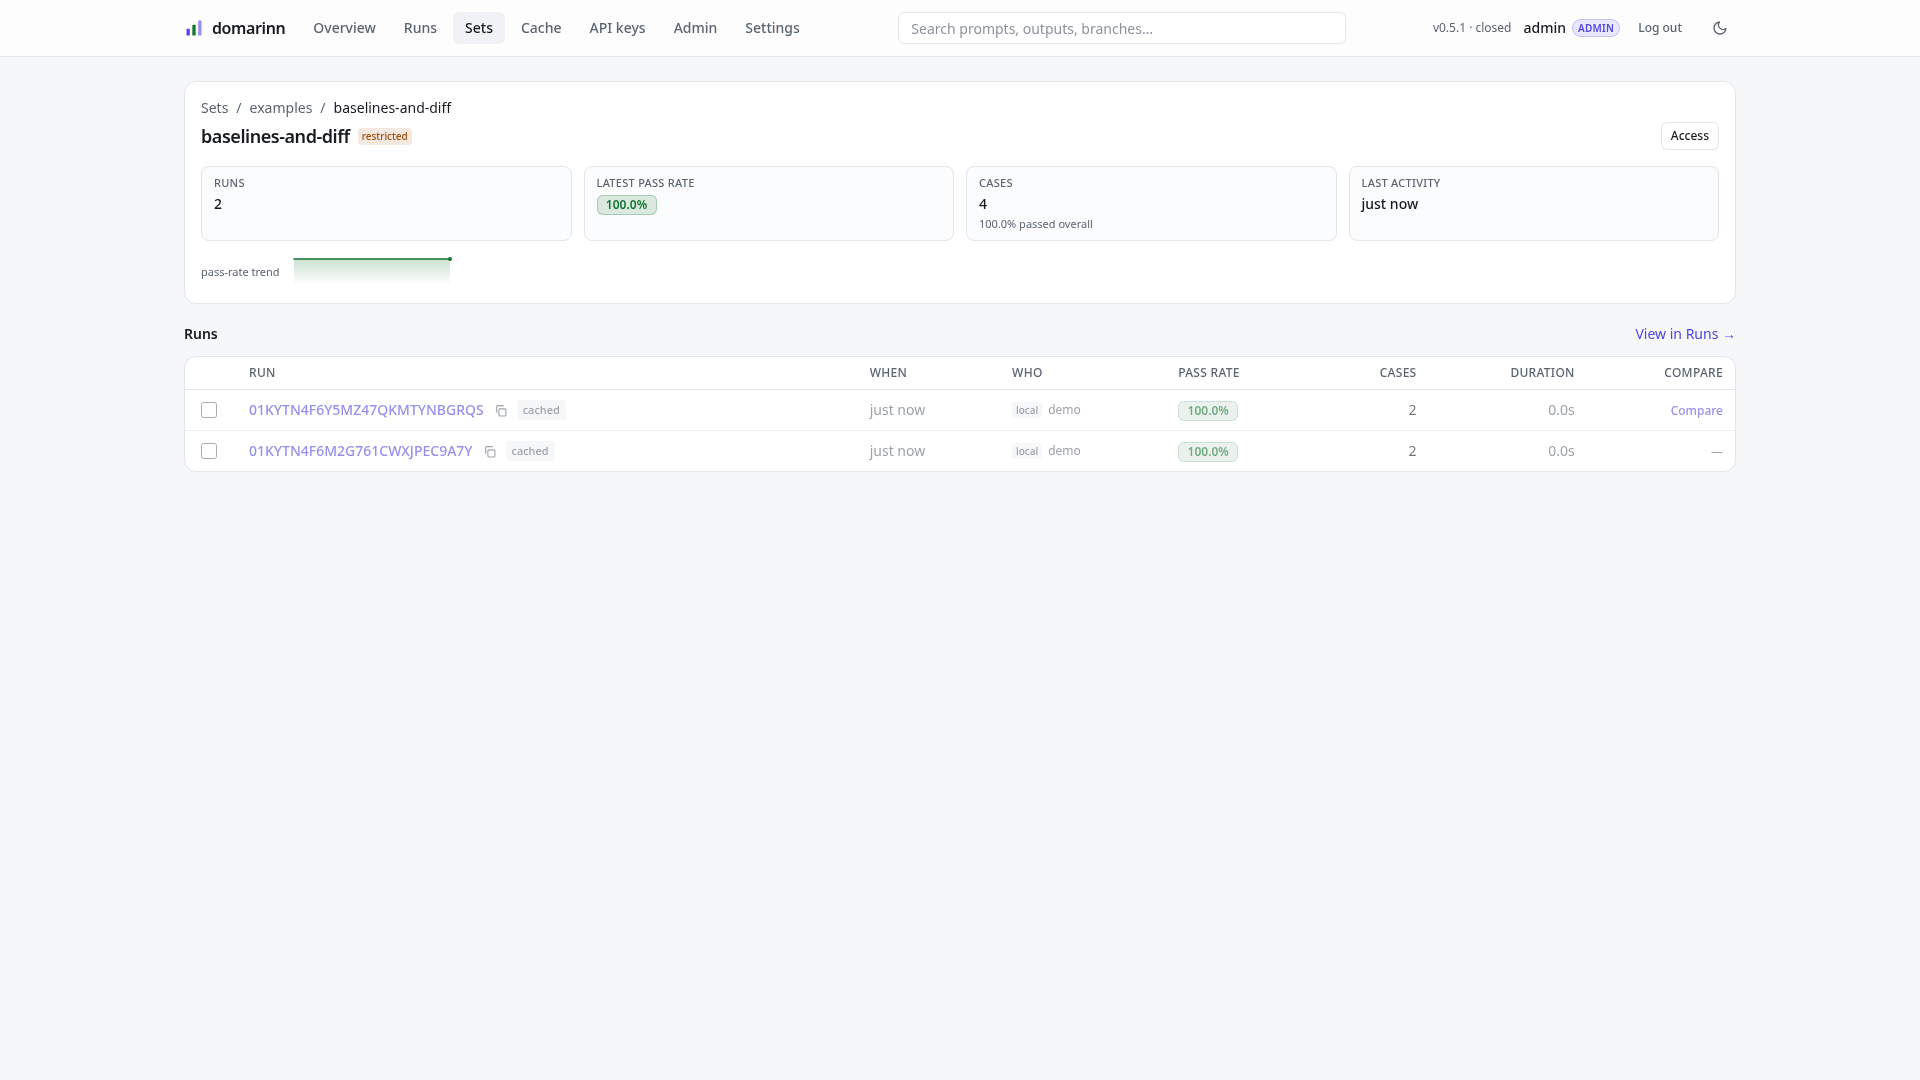
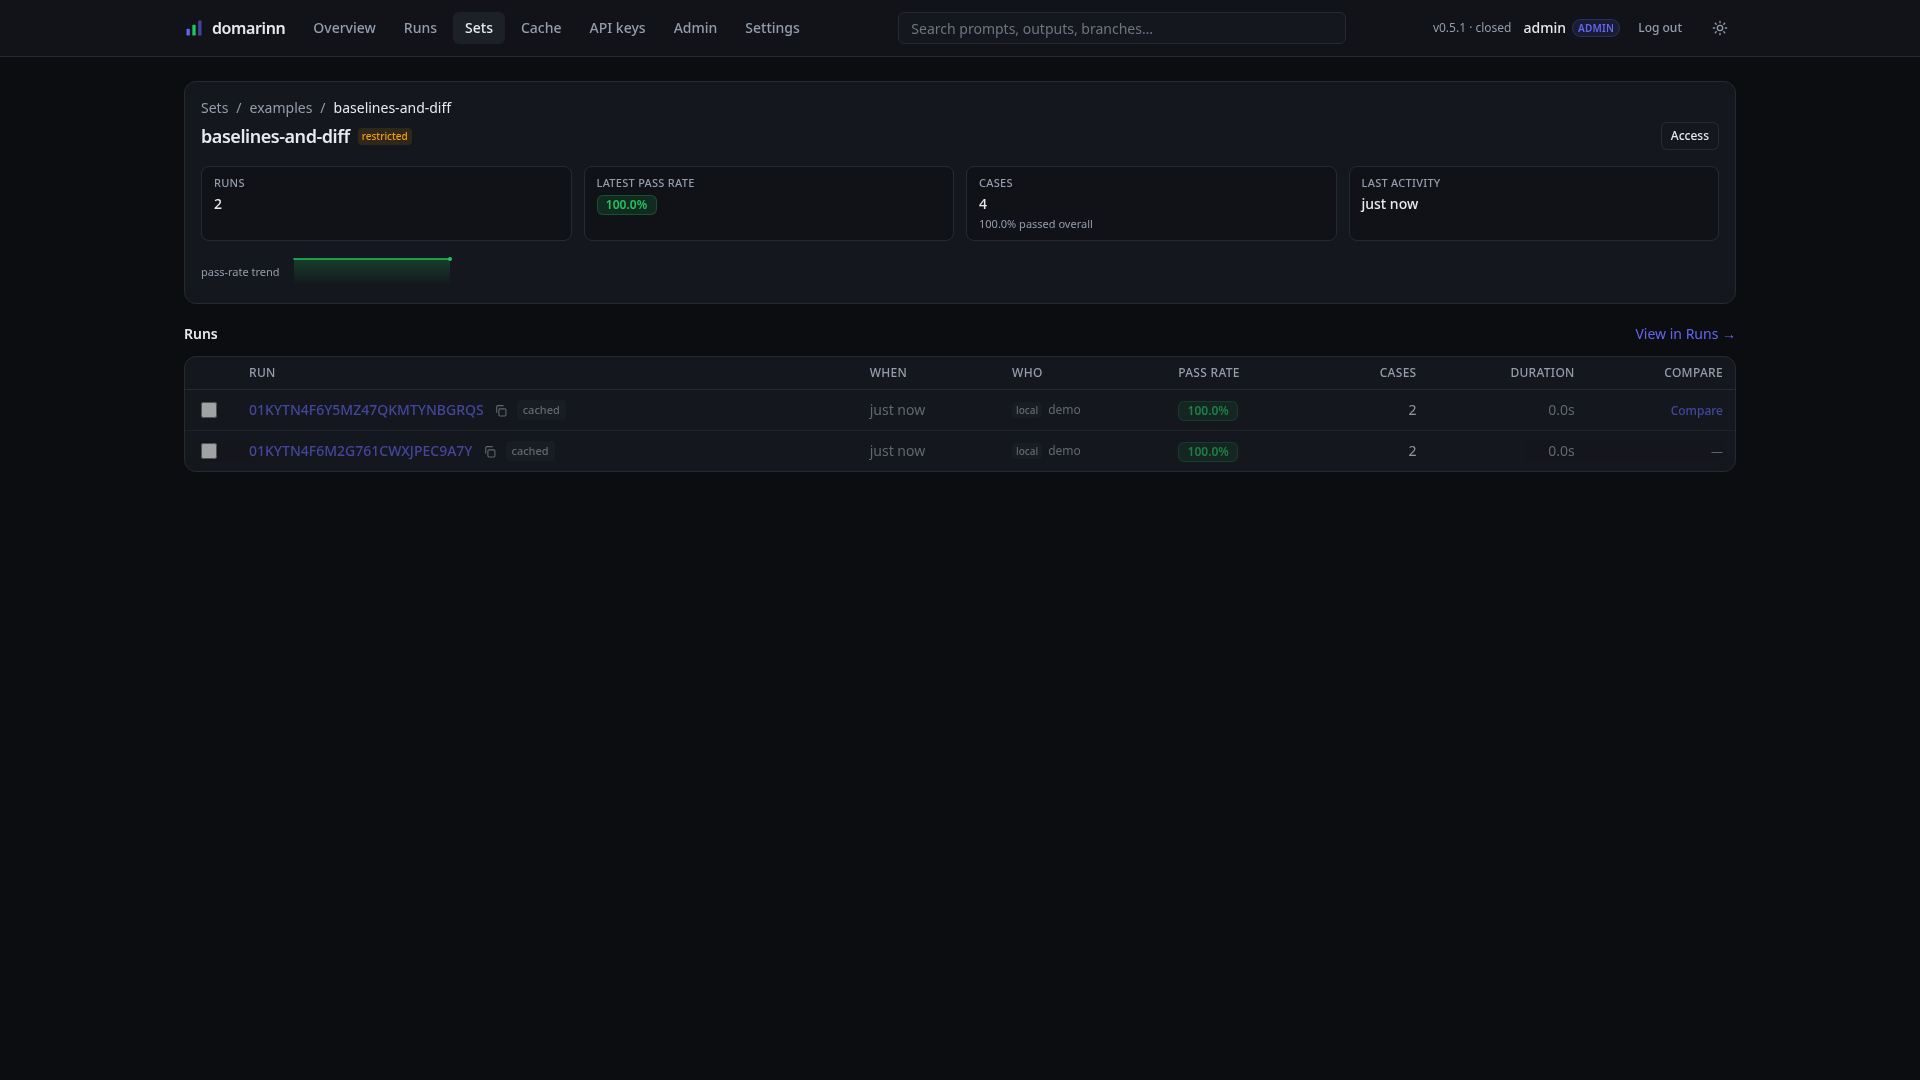
A suite's whole record on one page: how many runs, the newest run's pass rate, the case total with the share that passed across all of them, when it last ran, and a pass-rate trend as soon as there are two runs to draw a line between.
Below that, the suite's runs, under the same cached default as everywhere else — this shot is taken at ?cached=all, which is why both replays are listed and both carry a cached badge. Whenever the page is hiding some, it says so on the line above the table rather than letting the rows silently disagree with the RUNS 2 beside them. Tick two and Compare 2 runs opens them in Compare, older as base; the per-row Compare link takes a run against the one before it, which is why the oldest row has a — instead. View in Runs → hands the same project and suite to the runs list, carrying this page's own cached view through so the stream opens showing what the table did.
The restricted chip beside the heading, and the Access button opposite it, are the other half of this page.
Who may reach a set
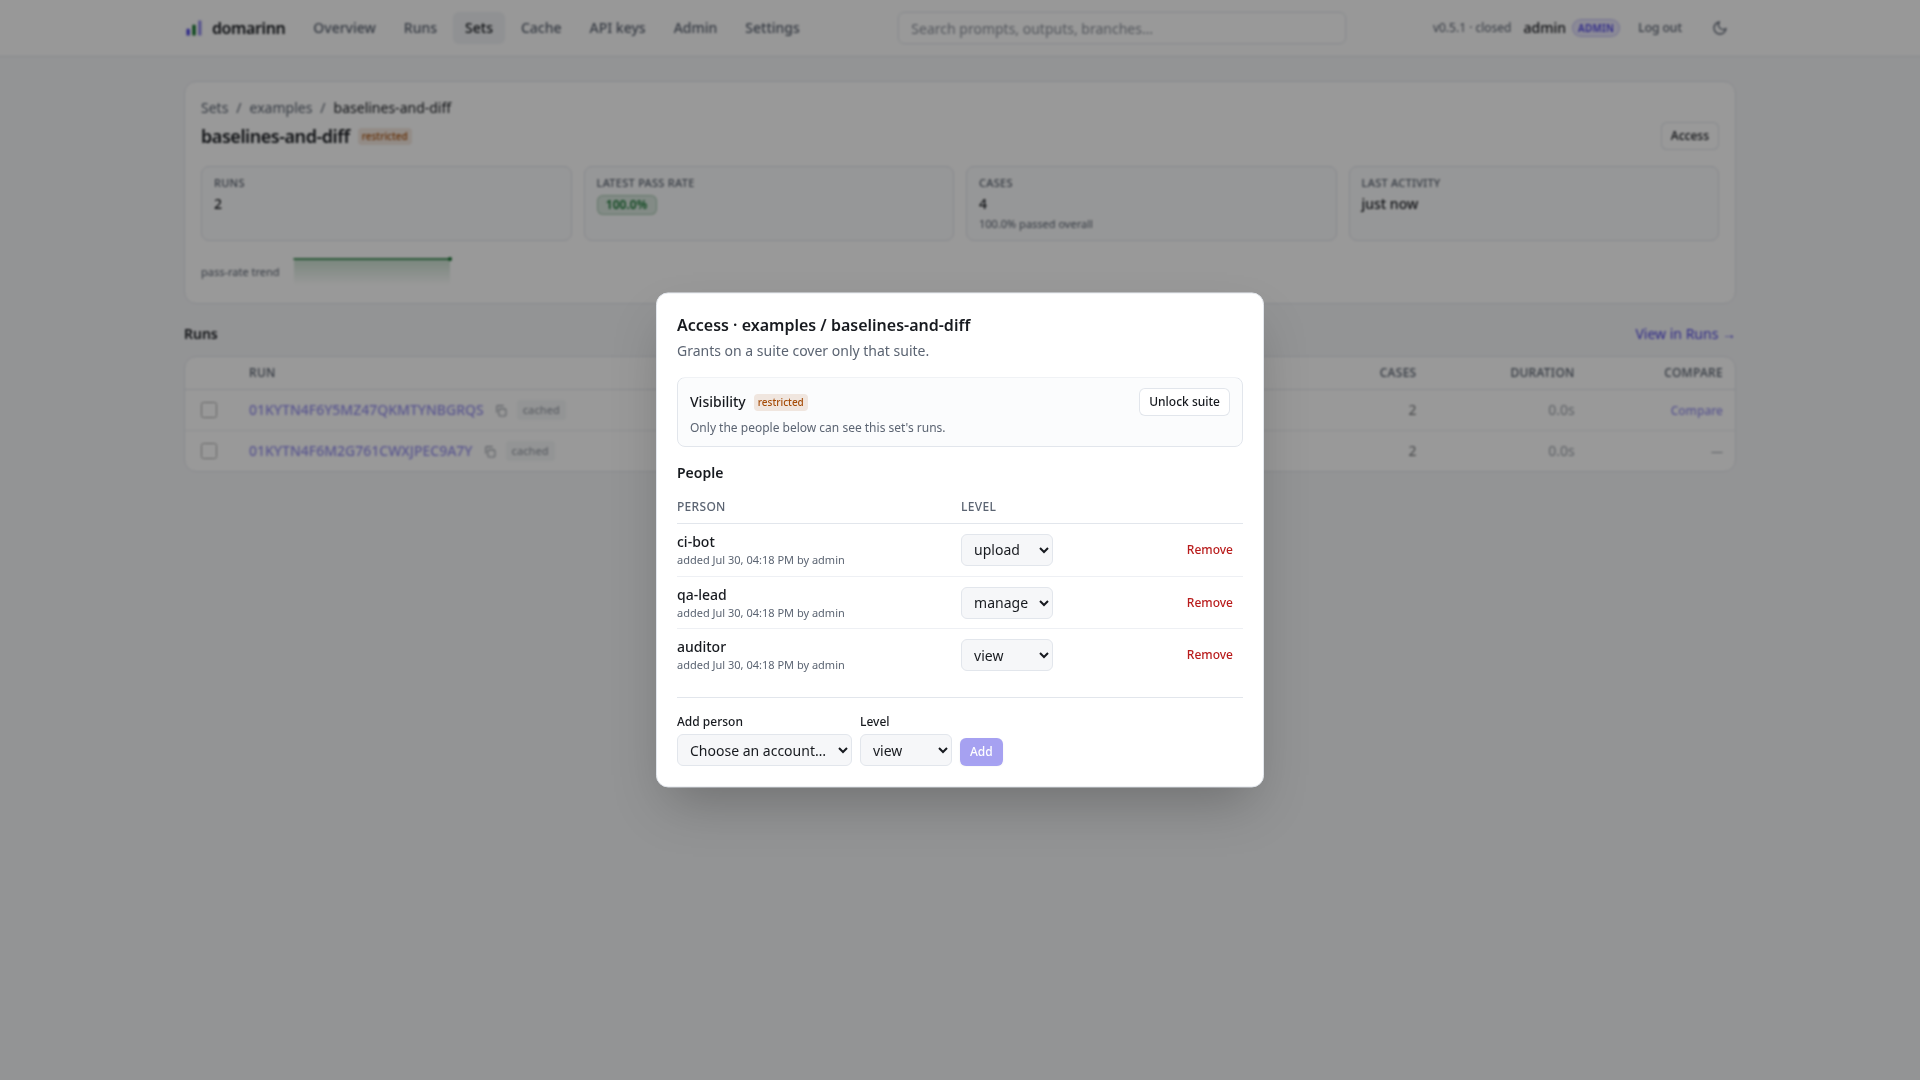
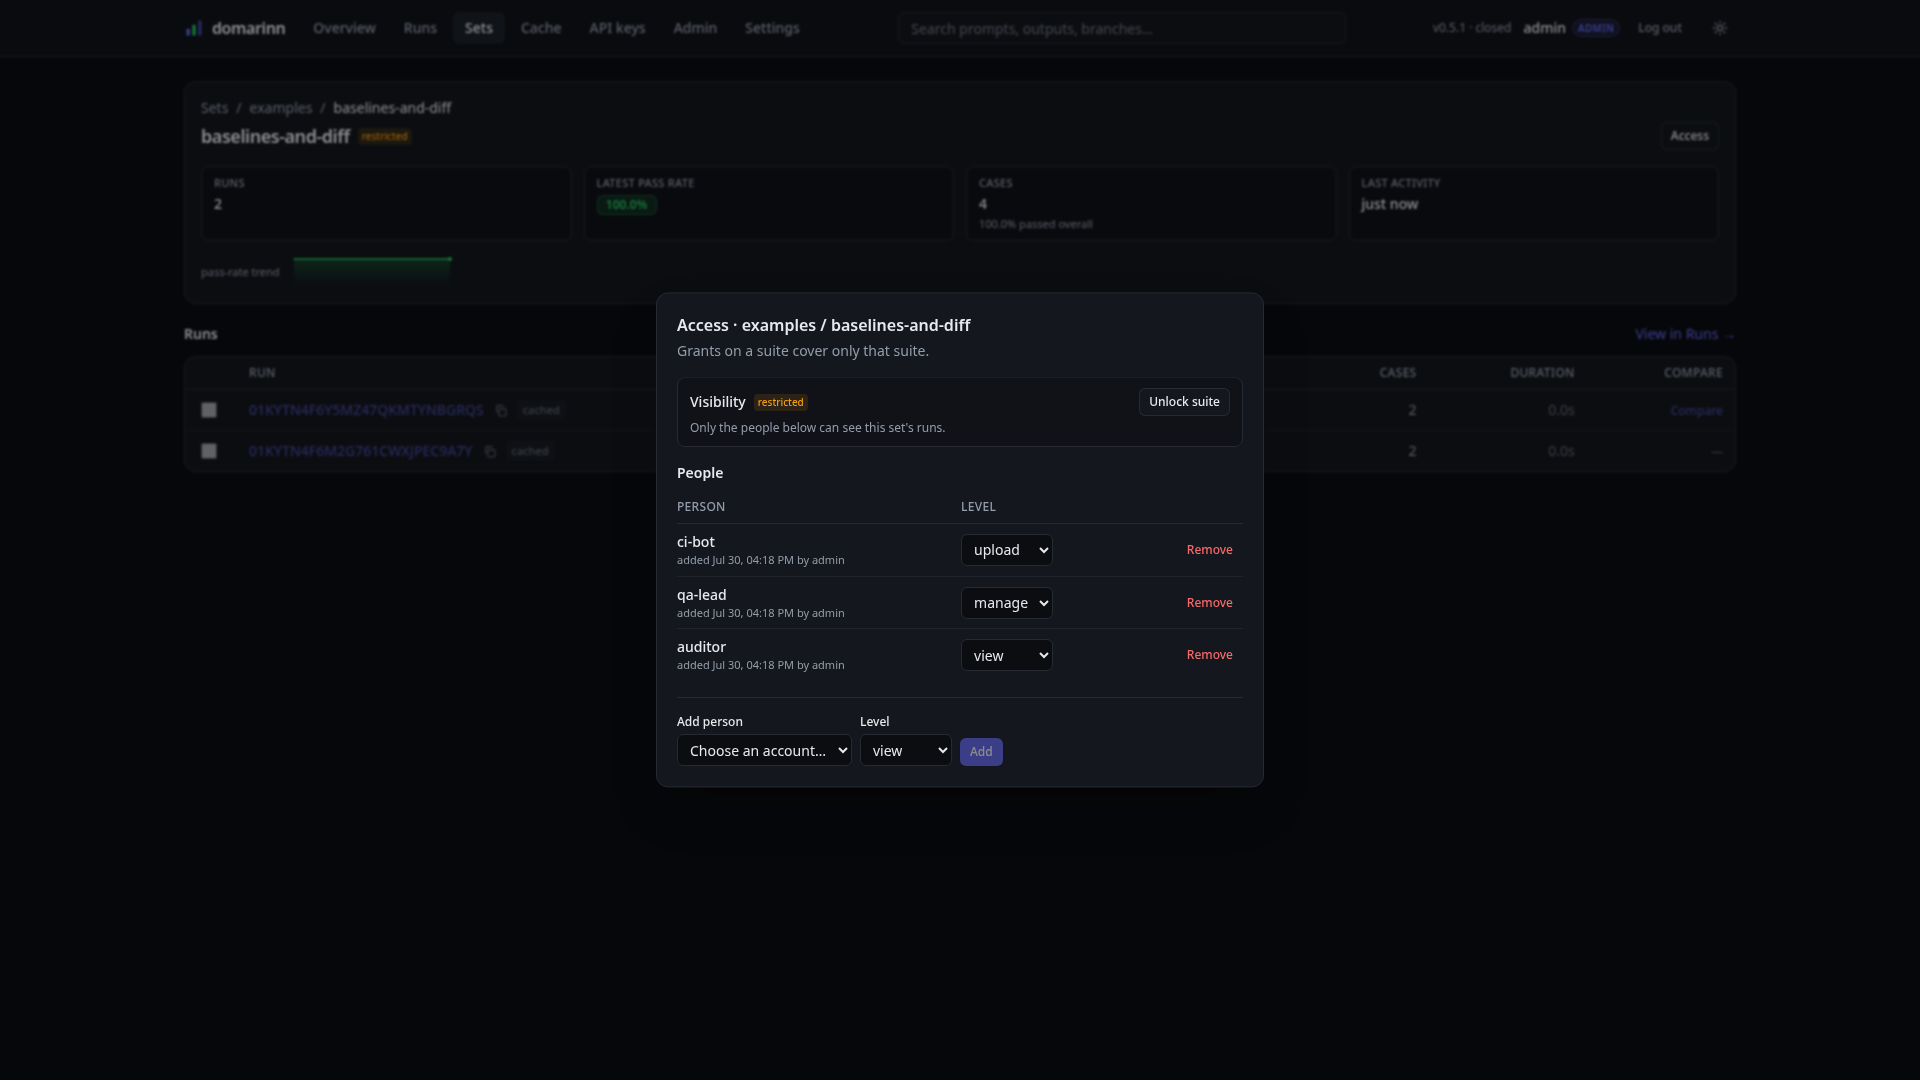
The model is default-open: until someone restricts a set, anyone who can read this server can read its runs, exactly as before this page existed. Restrict one and it disappears — from the runs list, from search, from compare, from the MCP tools, and from this browser — for everyone except the accounts on this list and any admin, who is never filtered by a grant. Addressing one of its runs directly by id answers 404, not 403: "you may not see this" and "there is nothing here" are deliberately the same answer.
Visibility states which of the two this set is, and Restrict suite / Unlock suite flips it. That button is admin-only — administering a set's access list is delegated, locking and unlocking is not — and unlocking keeps the grants, so re-locking the set restores the list it had. Grants come at three levels, each including the ones below it:
| Level | What it allows |
|---|---|
view |
Read this set's runs. |
upload |
Read, and upload runs into it — domarinn run --share, and pinning its baseline. |
manage |
Read, upload, and administer this list. |
The Access button appears for admins and for anyone holding manage over the set. Opened from a project page it edits the project-wide list, which covers every suite in the project — including suites nobody has uploaded to yet; opened from a suite it edits that suite alone. A suite that is hidden by its project's restriction says so, and names the project as the place that restriction is lifted.
Three things are worth knowing before you plan around this panel:
- A non-admin manager cannot add new people. The
Add personpicker is filled from the account list, and listing accounts is admin-only. Amanagegrant therefore lets you re-level and remove the people already on the list, but not extend it — ask an admin to add someone. - A read-only credential renders the panel read-only. Reading the list needs
readscope, changing it needswrite, so avieweraccount that holdsmanagecan see who is on the list and change nothing. The panel says so rather than offering controls that would be refused. - A set with no runs yet is not in this browser at all. Restrictions and grants may be created before a set's first upload — that is how you lock a project down in advance — but until a run arrives the set has nothing to list, so
/setsomits it and its page404s. Manage it through the REST API until then.
Static tokens are the other thing this page cannot show you, and they split in two. A read or write DOMARINN_TOKENS entry has no owning user, so it holds no grants and never pierces a restriction — for CI that uploads into a restricted set, give the job an API key belonging to an account you granted upload instead. An admin: entry is the opposite: admin scope sees and manages every set on the instance, exactly like an admin account. See Server.
Search
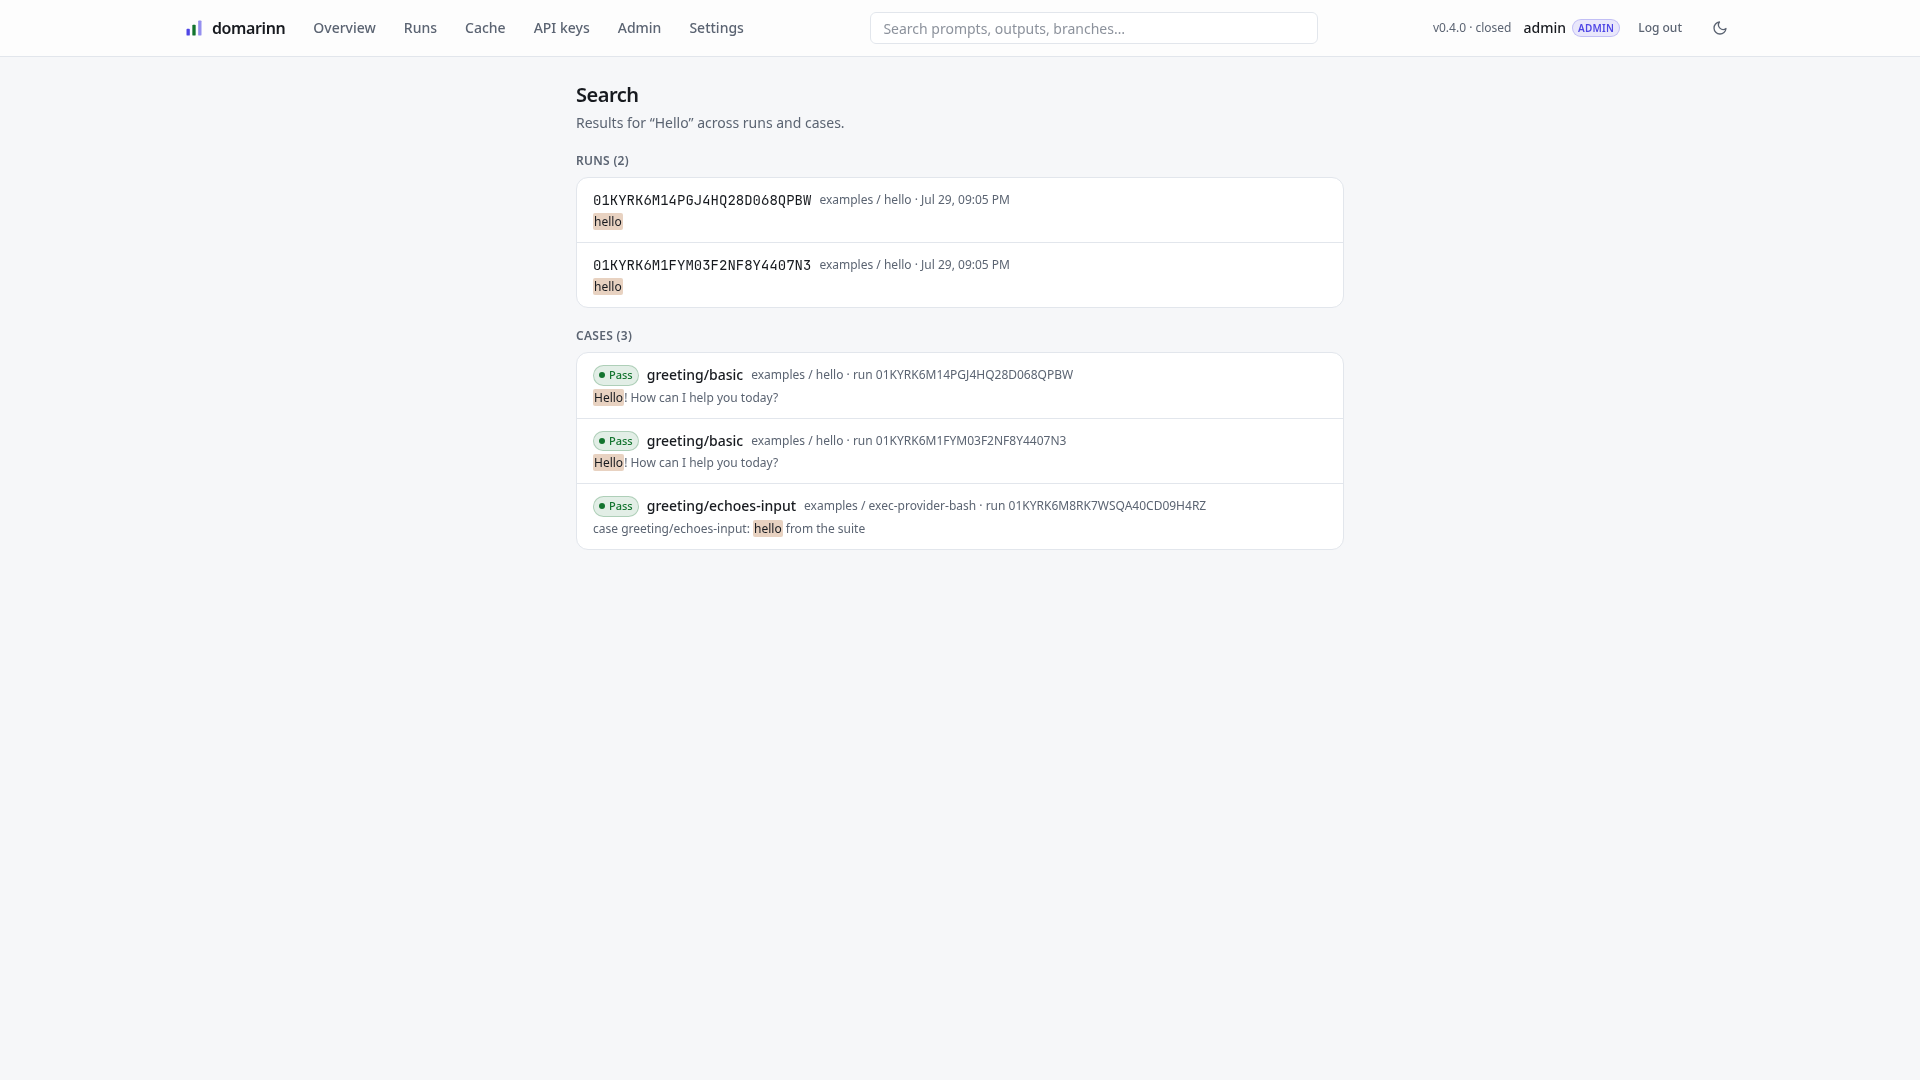
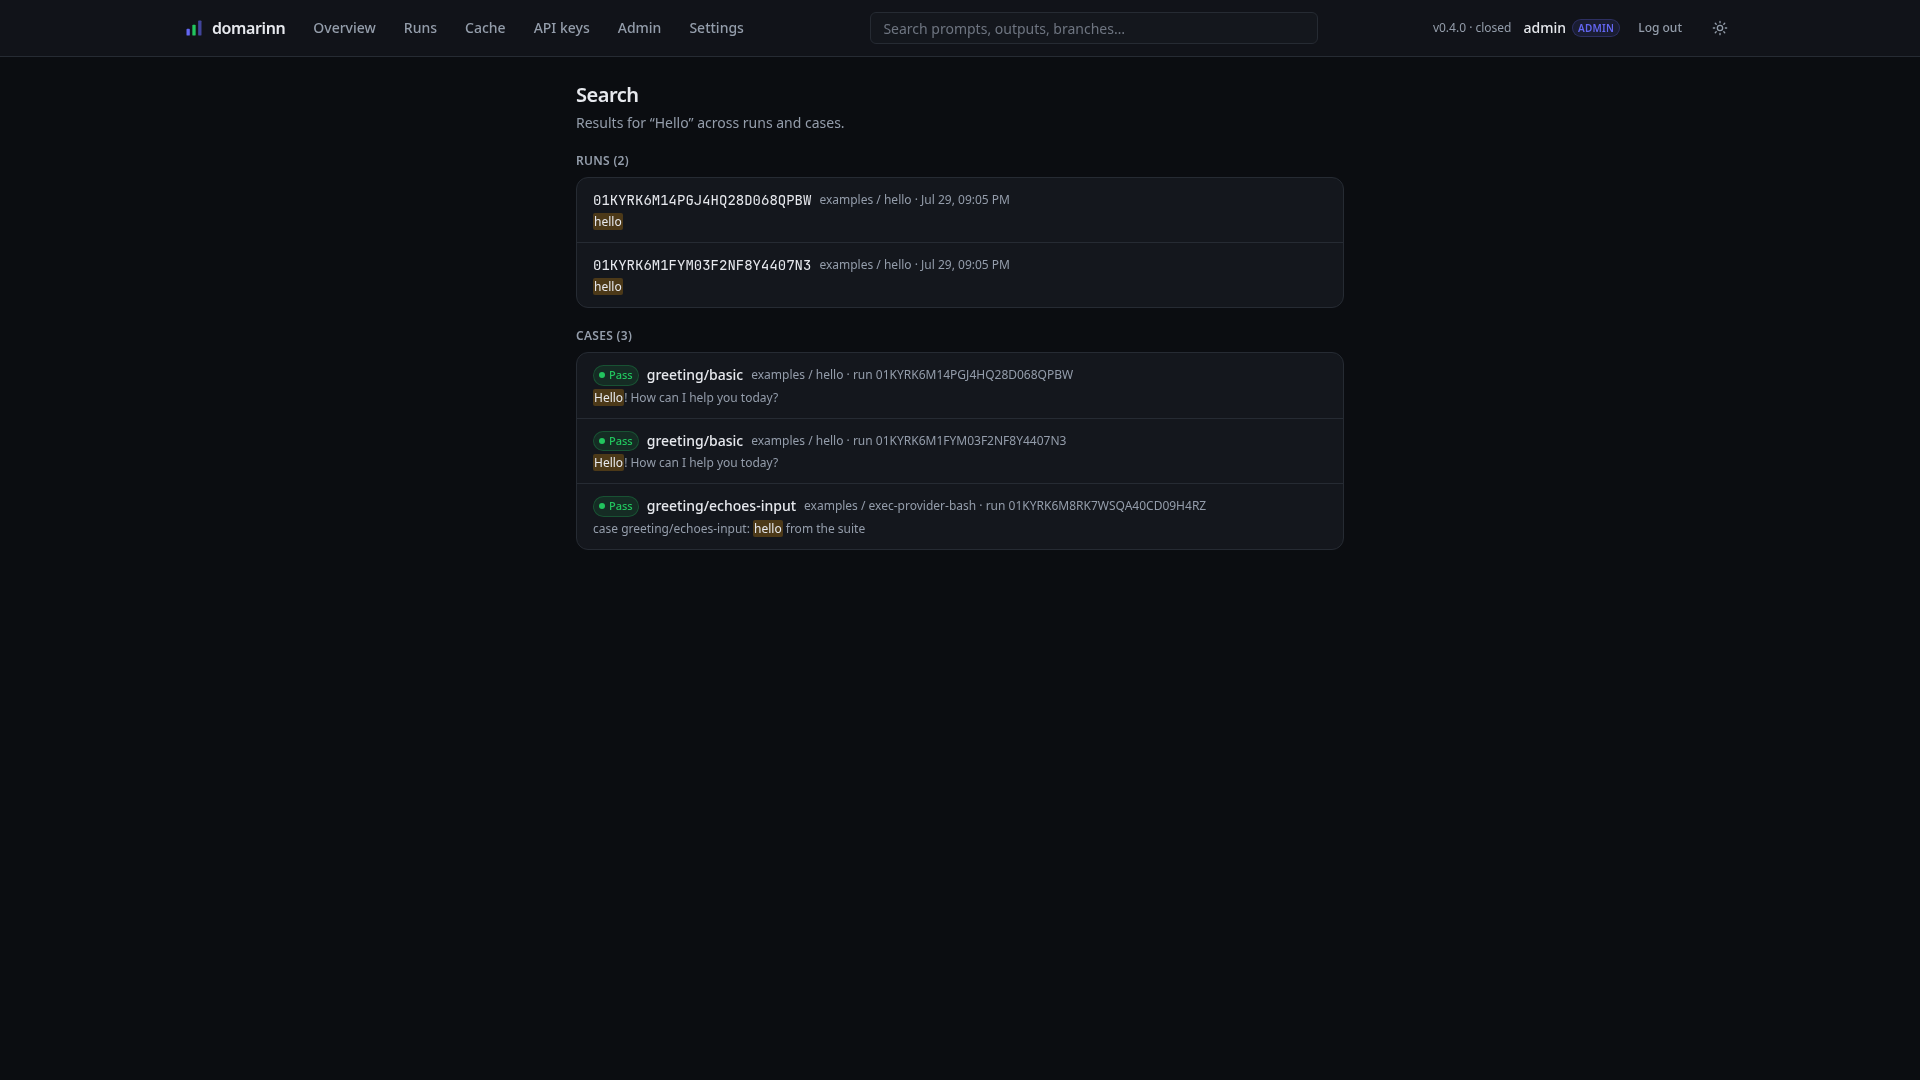
The header search box queries runs and cases together and highlights the matched term in context. Runs match on their metadata — project, suite, branch, commit, description, tags — and cases match on their name and their output, which is the half that gets used: "which case ever emitted this internal identifier" is a question you ask exactly when you least want to grep a directory of JSON.
Results are grouped by kind with a count per group, and each case hit names the suite and run it came from, so a hit is one click from the drawer that explains it. The query here is Hello, which example 01 asserts on, and the hits show both the runs and the individual passing cases whose output contains it.
Cache stats
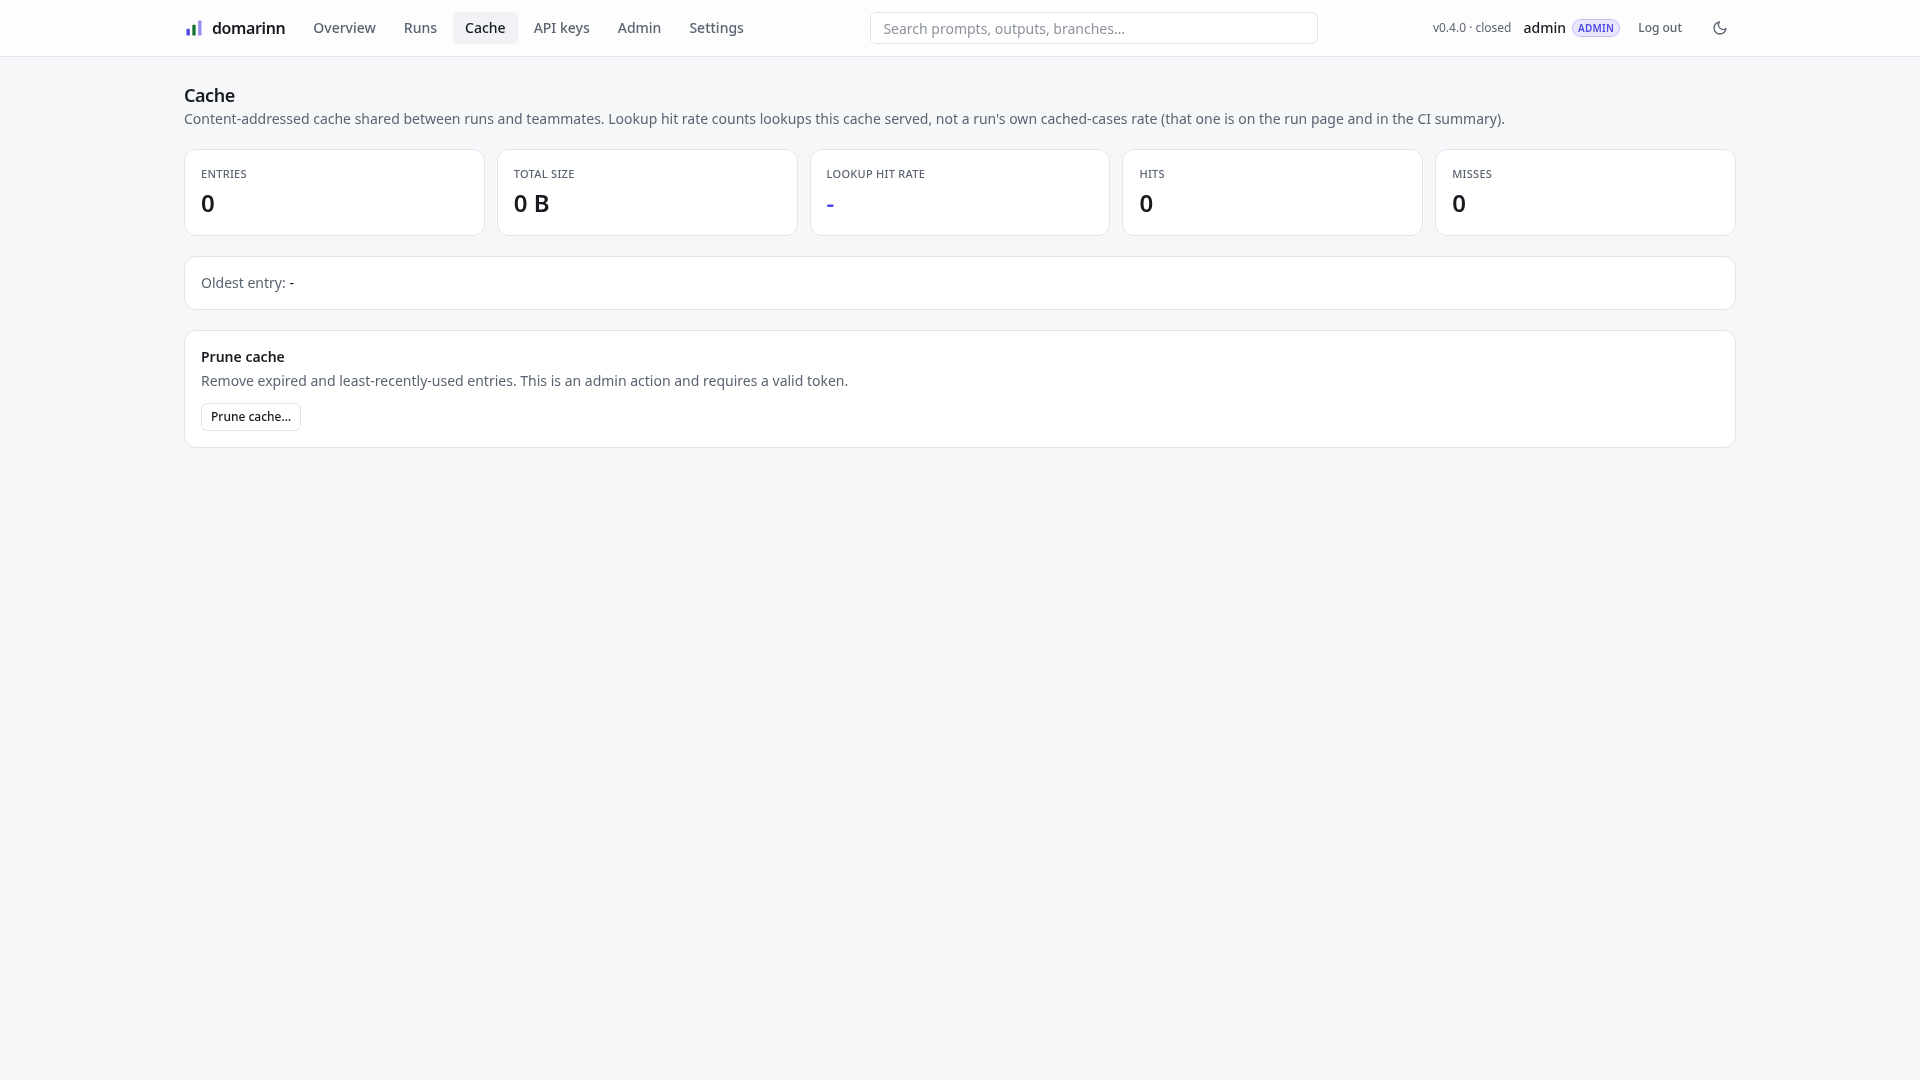
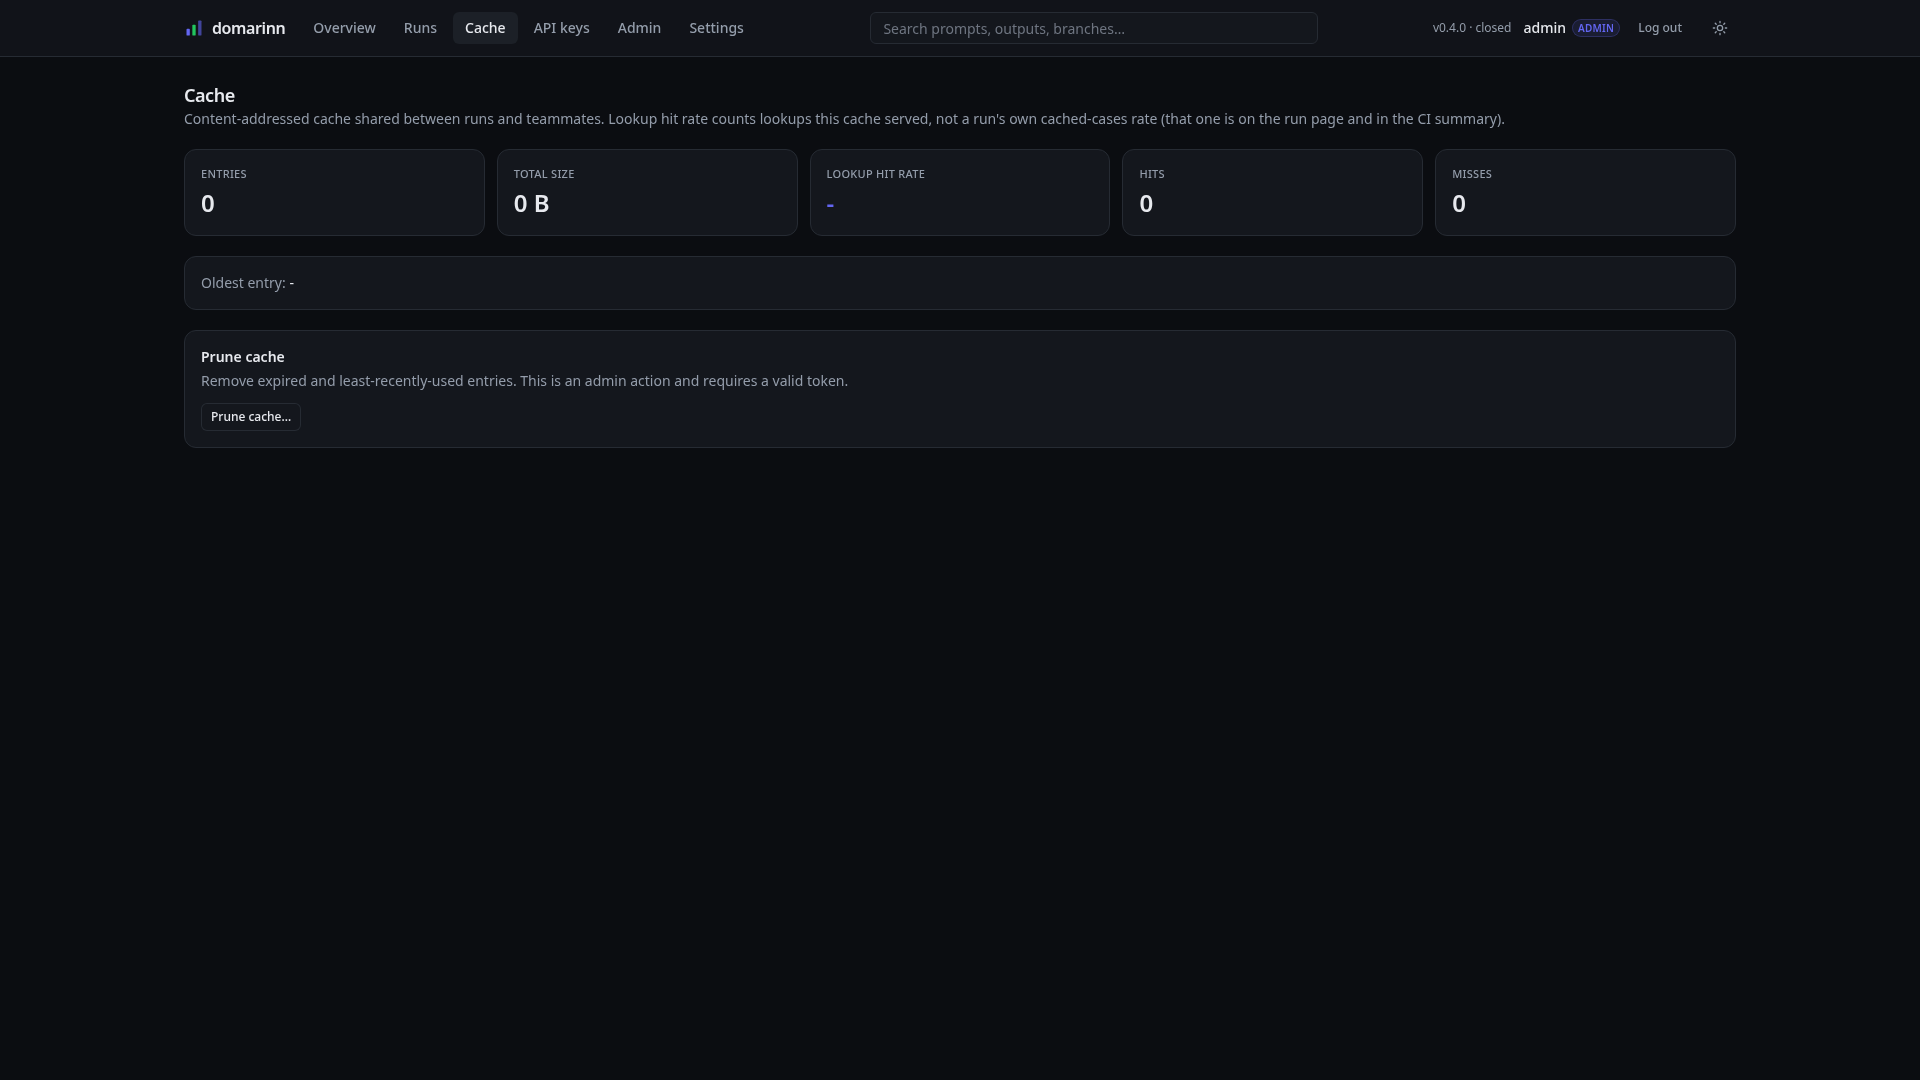
Entry count, total size, lookup hit rate, hits, misses, and the age of the oldest entry — for the cache this server hosts, not the one on your laptop. Every counter reads zero in this shot, and that is the most useful thing about it: the demo runs used a local disk cache, so they never asked this server for anything. A shared tier only fills up once a suite sets cache.backend: layered and points at the server, which is how a team stops paying separately for the same answers.
The distinction is worth internalising because the two numbers get confused constantly: LOOKUP HIT RATE counts lookups this cache served, while the CACHE figure on a run detail page is that run's own cached-case rate, wherever the answers came from. A run can be 100% cached with this page at zero.
Prune cache… runs retention on demand — expired and least-recently-used entries — and is an admin action. Retention also runs hourly on its own, bounded by DOMARINN_CACHE_MAX_BYTES and DOMARINN_CACHE_MAX_AGE_DAYS (see Server).
Cache entries
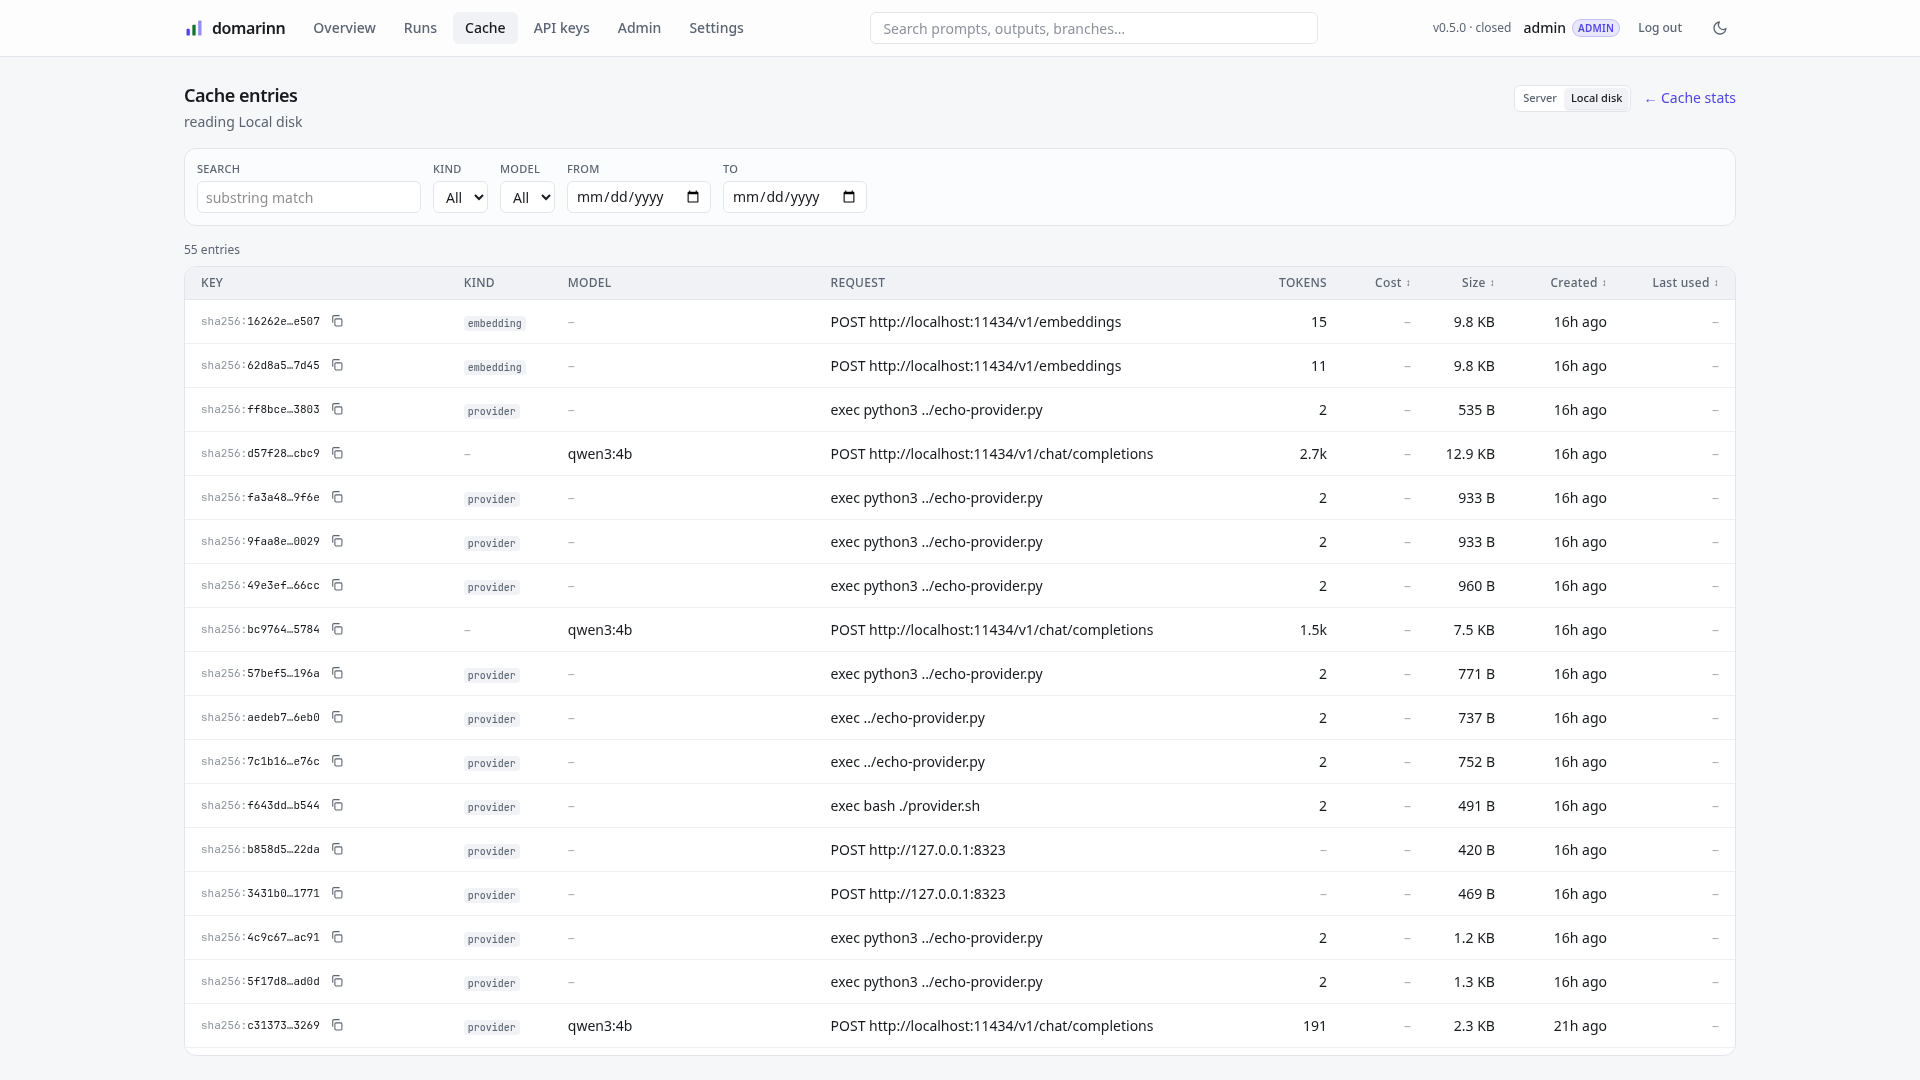
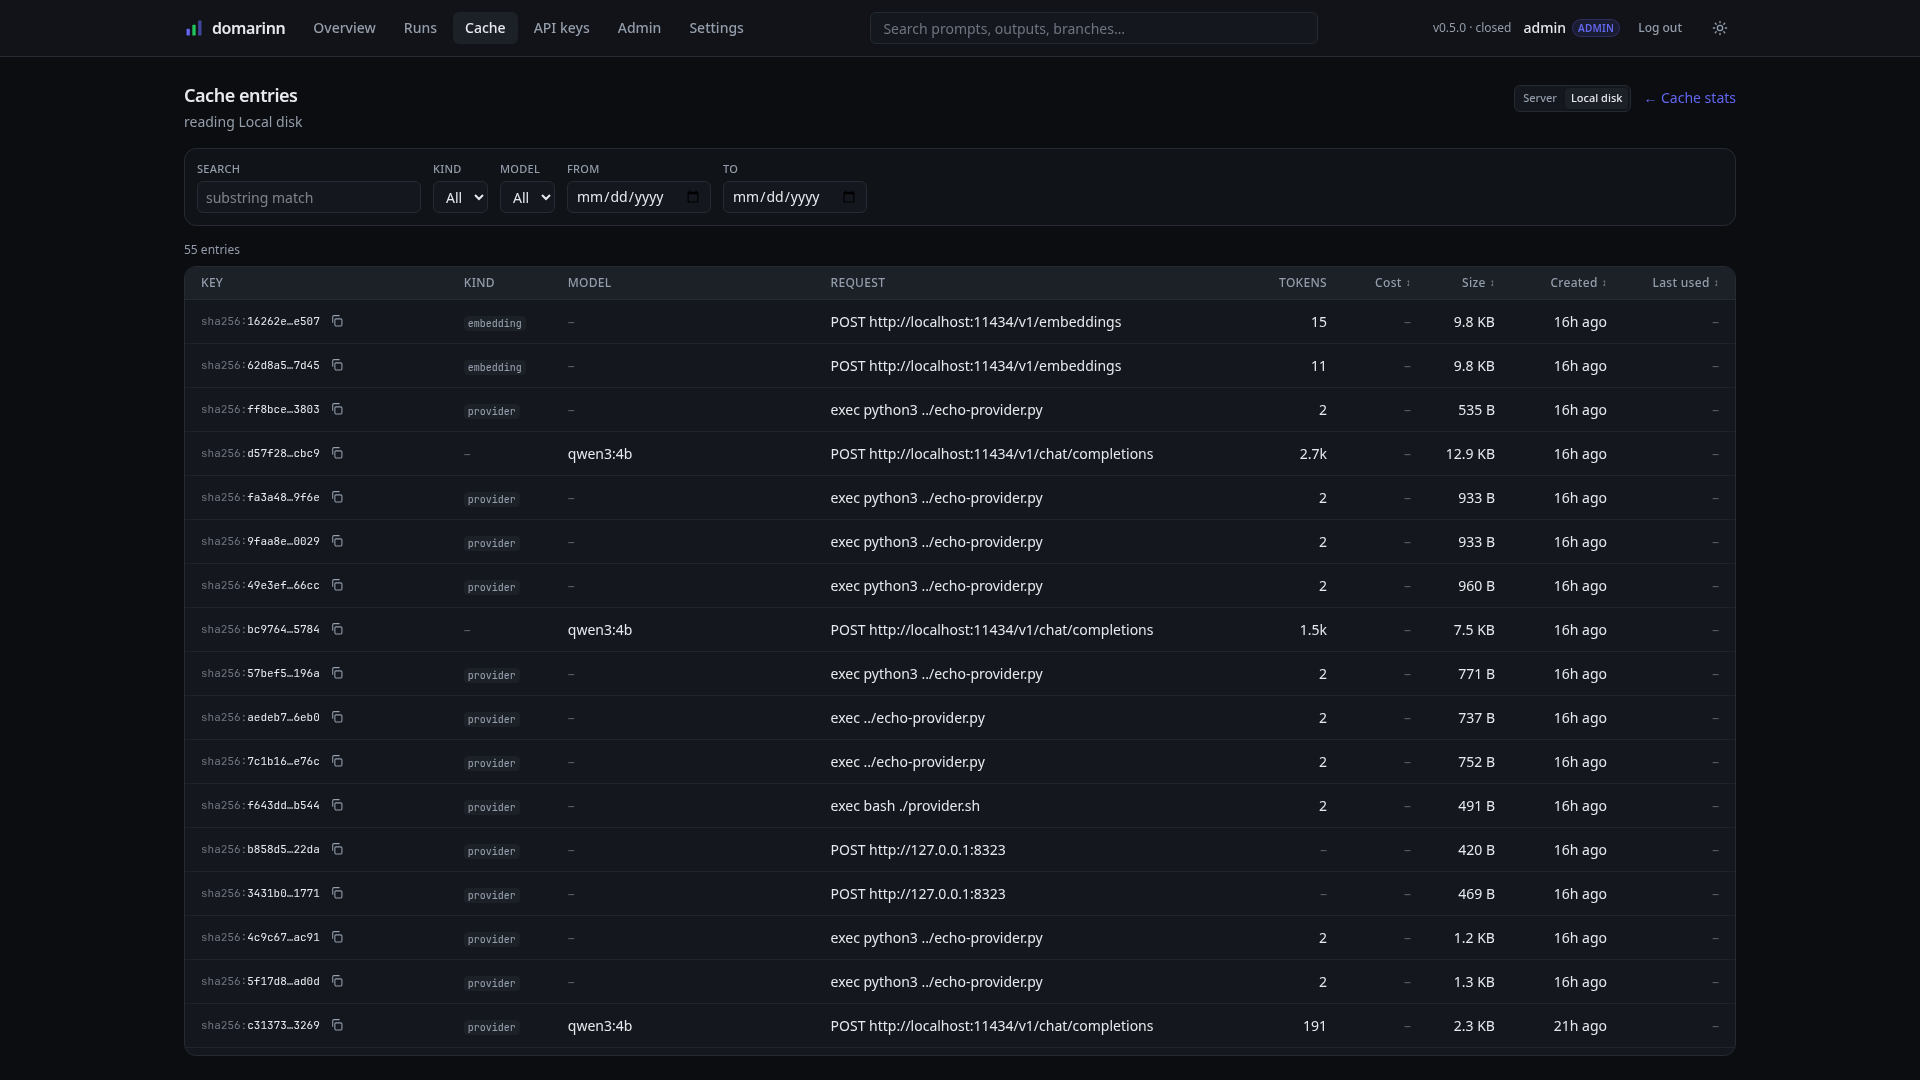
Browse entries → leads from the stats page to the entries table, which answers the question the tiles cannot: what is actually in there.
The shot above is the local disk tier, and that is not a convenient choice — it is the only tier with anything in it. These runs cached to disk like every default setup, which is exactly why the stats page above reads zero. Last used is empty for the same honest reason: a filesystem has no reliable access time, and printing its modification time under that heading would be a different measurement wearing the same name.
Each row is one cached exchange — its key, what kind of call it answered (provider, judge, embedding, exec_assert), the model, where the request went, tokens, cost, size, and when it was created and last used. Filter by kind or model, narrow by date, or search the request and output text. Sorting is done by the server, not within the loaded page, so Size really does surface the largest entry in the cache rather than the largest one currently on screen — which is why only the four columns the database can order by are sortable.
Clicking a row opens a drawer with the request beside the response it produced, plus reasoning, tool calls, and the provider's raw metadata on request. Two states are worth recognising:
indexing…— the entry is listed but its body has not been read yet, so its model, kind and cost are unknown rather than absent. Filters and search cannot reach it until the background pass catches up; the stats page reports how many are left.opaque— this server could not parse the entry. It is stored and served to clients unchanged; most often it was written by a newer domarinn. Nothing is lost, there is simply nothing to describe.
Entries written before 0.5 predate request capture, so their drawer shows the fingerprint of the provider that answered instead of the request itself.
Listing entries is an admin action, and deliberately more restricted than reading one. A cache key is a hash of the exact request, so fetching one by key never revealed anything the caller did not already have. Enumerating does: it turns "you already know the prompt" into every prompt and response on the server, searchable. Since read is the anonymous scope under protect-writes, that belongs with Prune cache… rather than with the run views.
Settings
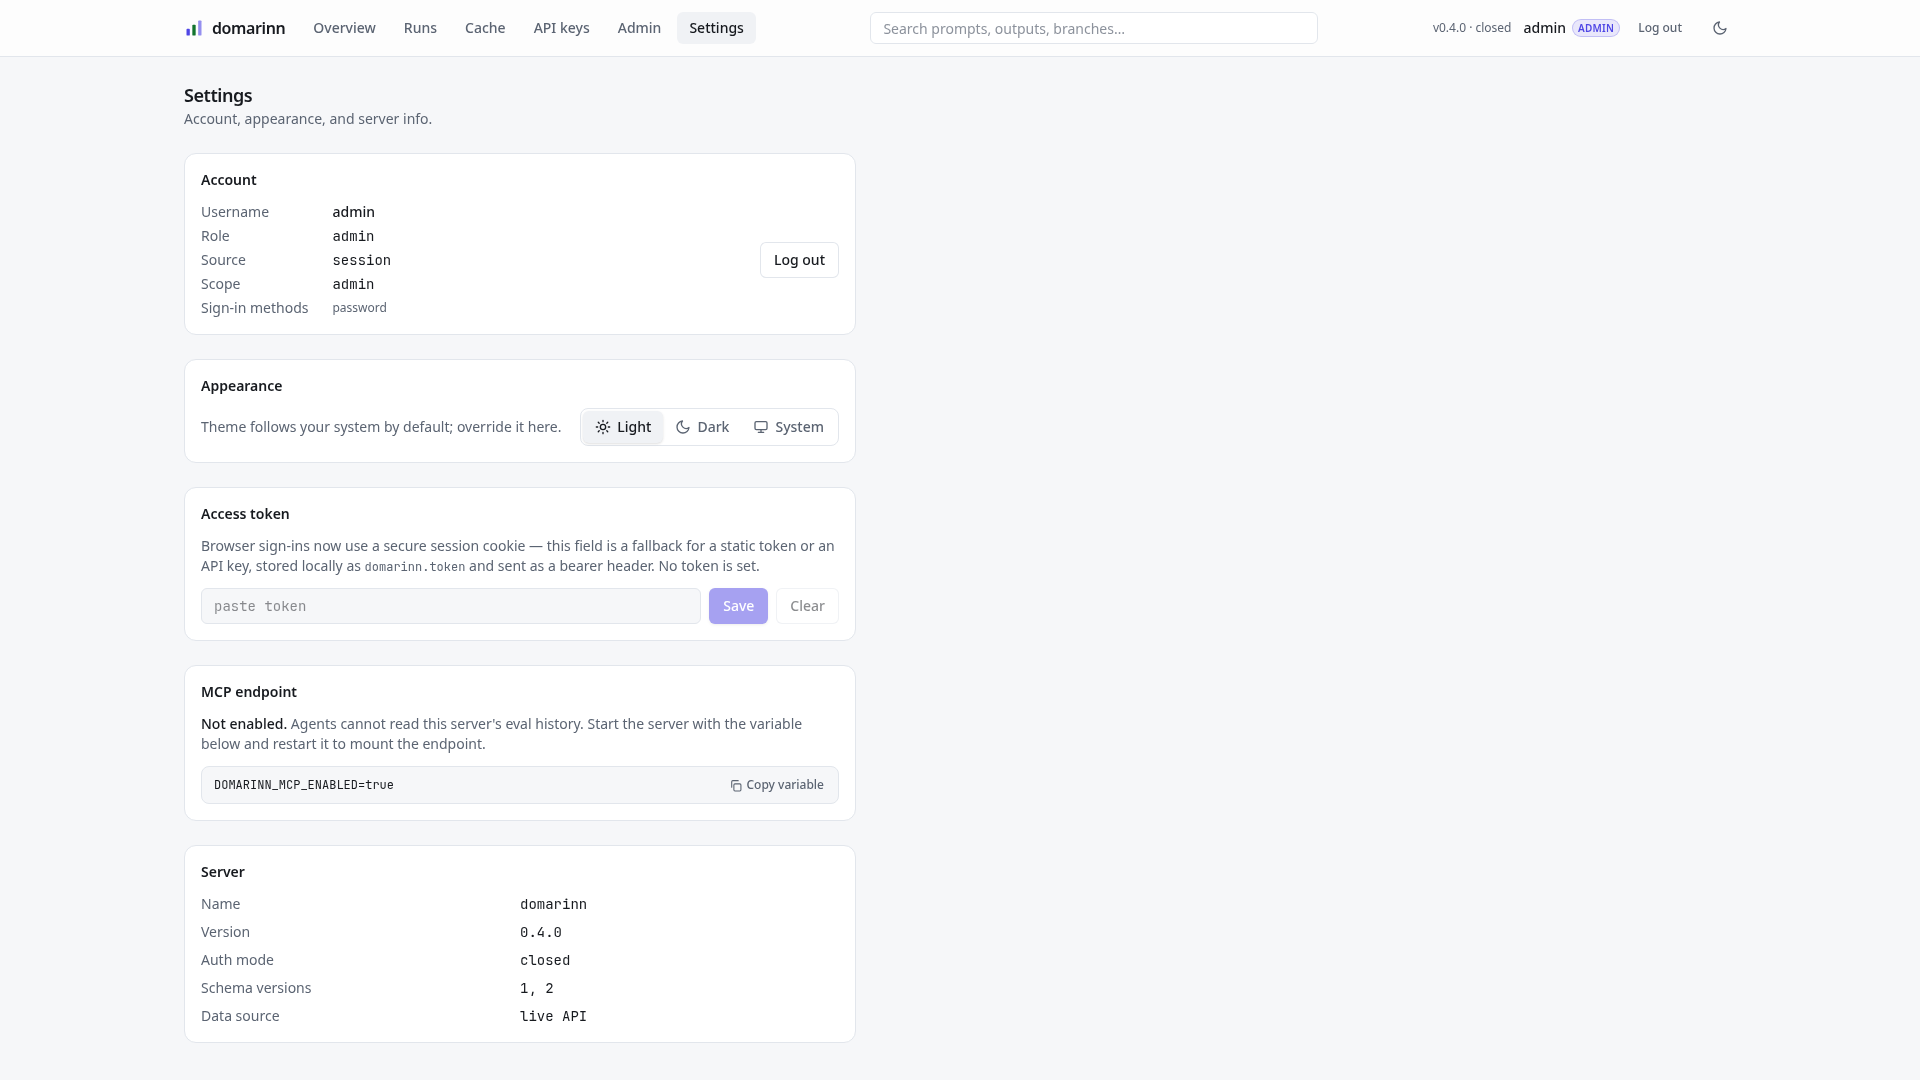
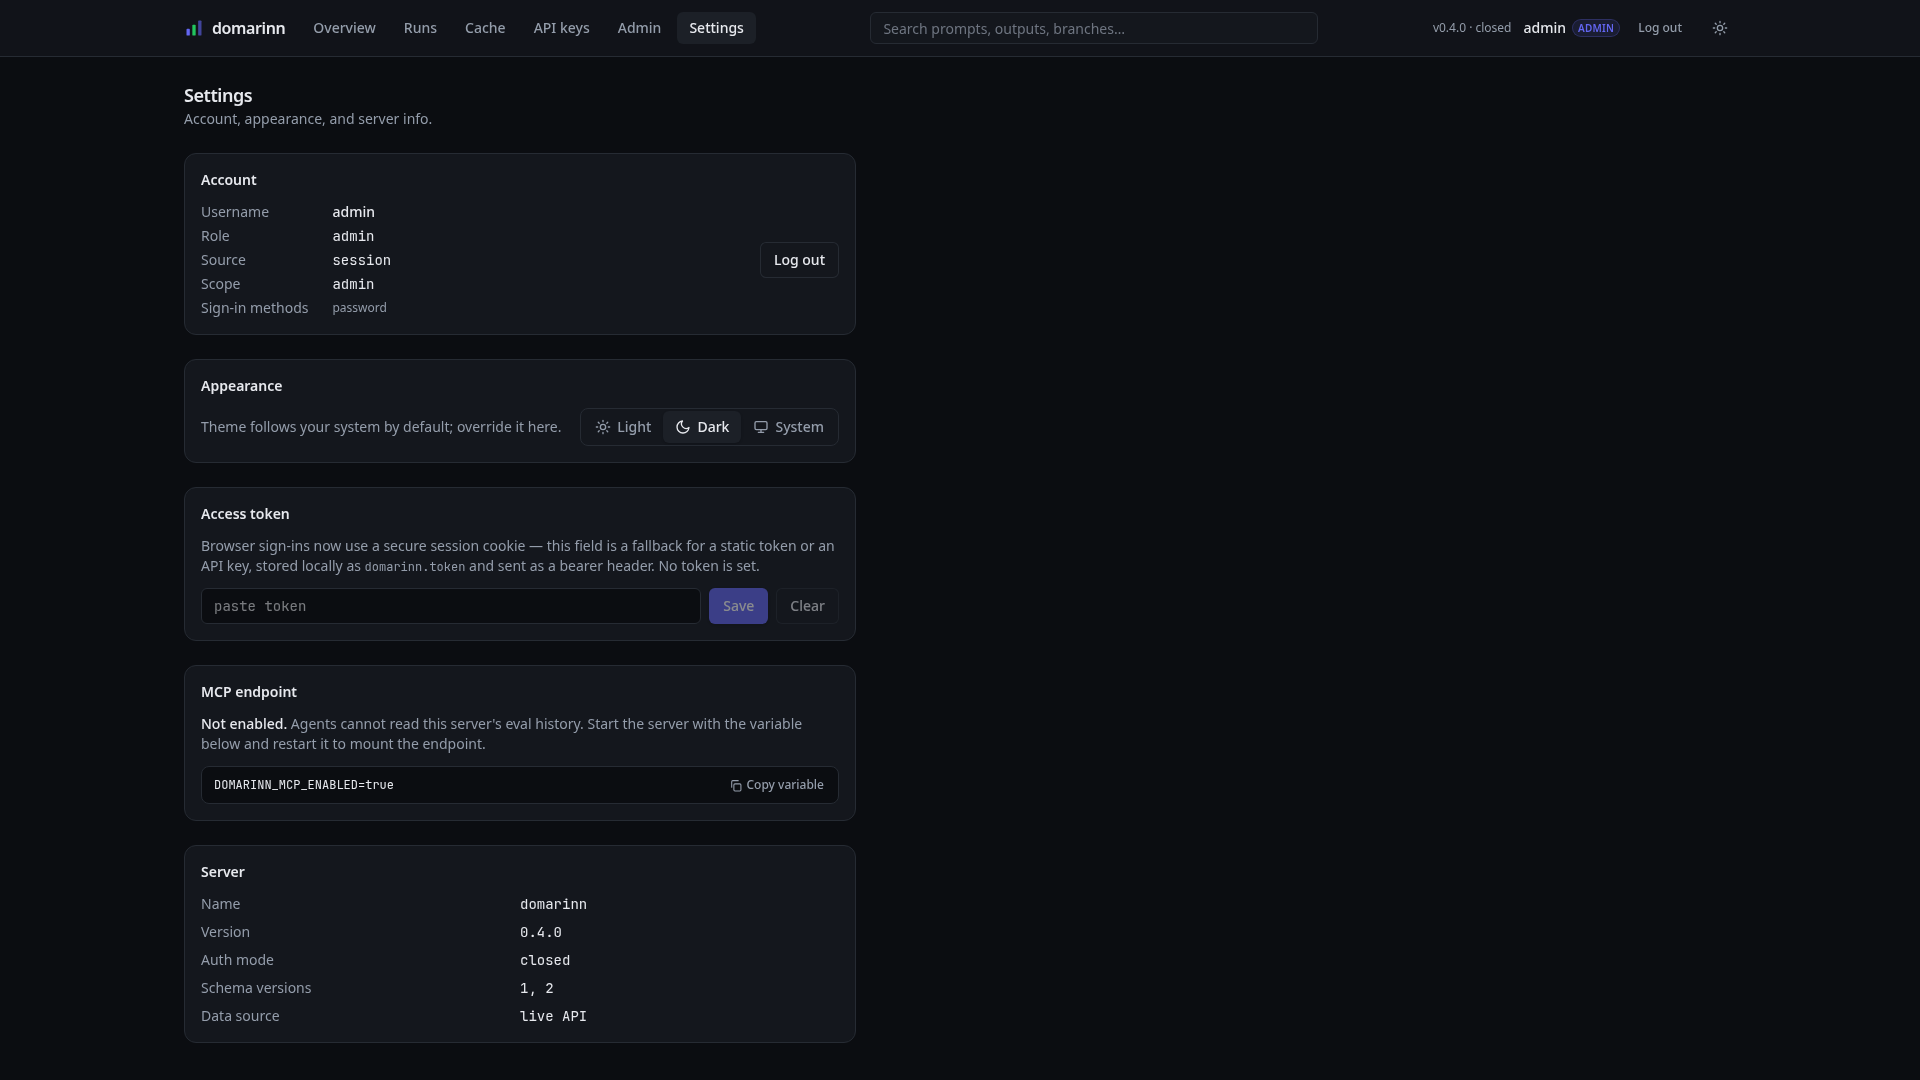
Five panels, and three of them answer support questions before they are asked.
Account states not just who you are but how you got in: the Source row distinguishes a browser session from a static token or an API key, Scope is the ceiling this credential actually carries, and Sign-in methods lists what this account can authenticate with (password here; an SSO-provisioned account lists its provider instead and has no password at all).
Appearance overrides the system theme for this browser. Access token is the legacy fallback for pasting a static token or API key into the UI — browser sign-ins use the session cookie now, and this field says plainly when no token is set.
MCP endpoint reports whether agents can read this server's eval history, and if not, hands you the exact variable to set (DOMARINN_MCP_ENABLED=true) with a copy button. See MCP endpoint. Server is the panel to screenshot into a bug report: name, version, active auth mode, the run-document schema versions this build accepts, and whether the UI is talking to a live API at all.
API keys
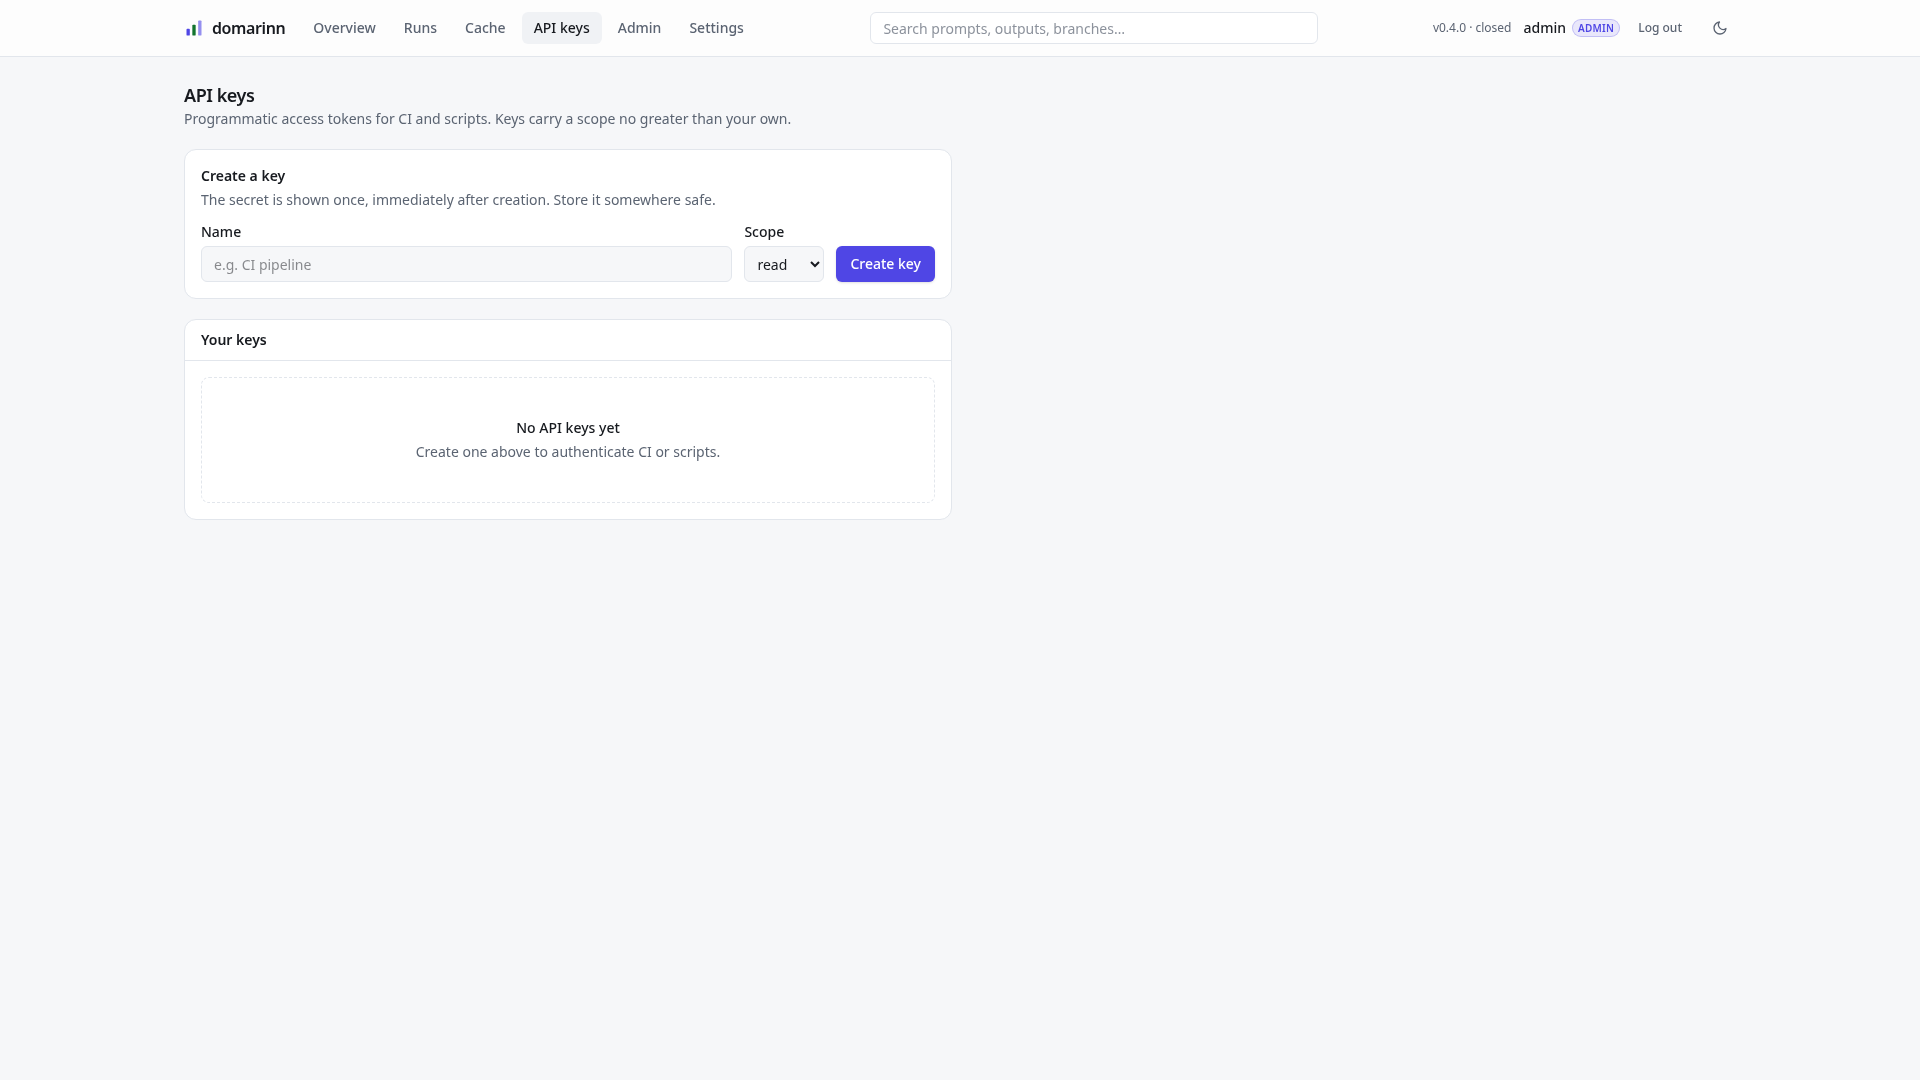
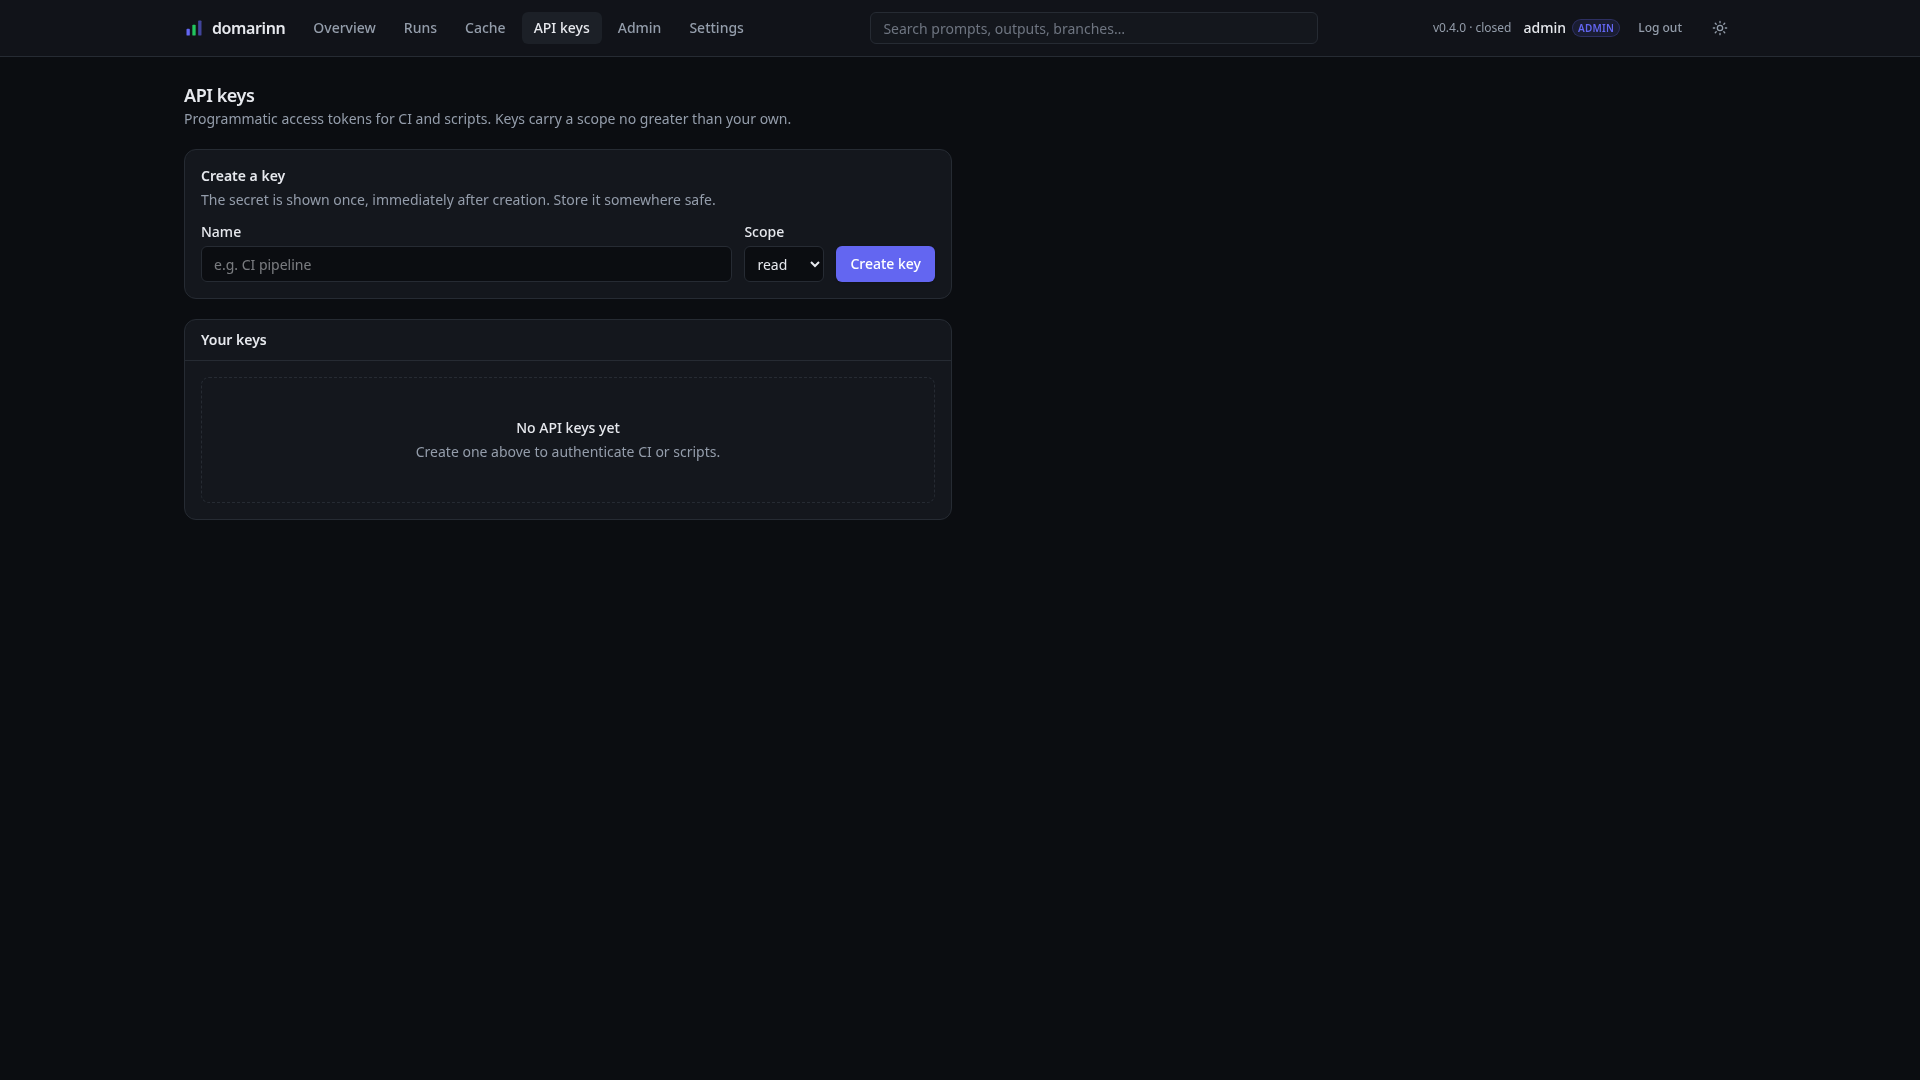
API keys are the credential for CI and scripts that should be attributable to a person. Name one, pick a scope, and the secret is displayed exactly once, immediately after creation — the page says so before you click, because there is no second chance and no recovery path.
The scope selector is capped at your own: a member cannot mint an admin key, a viewer gets read and nothing else, and no key can outrank the account that created it. A key also rides its owner's run-set grants, whatever scope it was minted at — which is exactly what a static token, having no owner, cannot do. Keys are revocable at any time, and revoking one takes effect immediately for every script holding it. For a credential with no user behind it — bootstrapping, a shared CI runner — use a static DOMARINN_TOKENS entry instead; the two kinds are compared in Server.
Admin
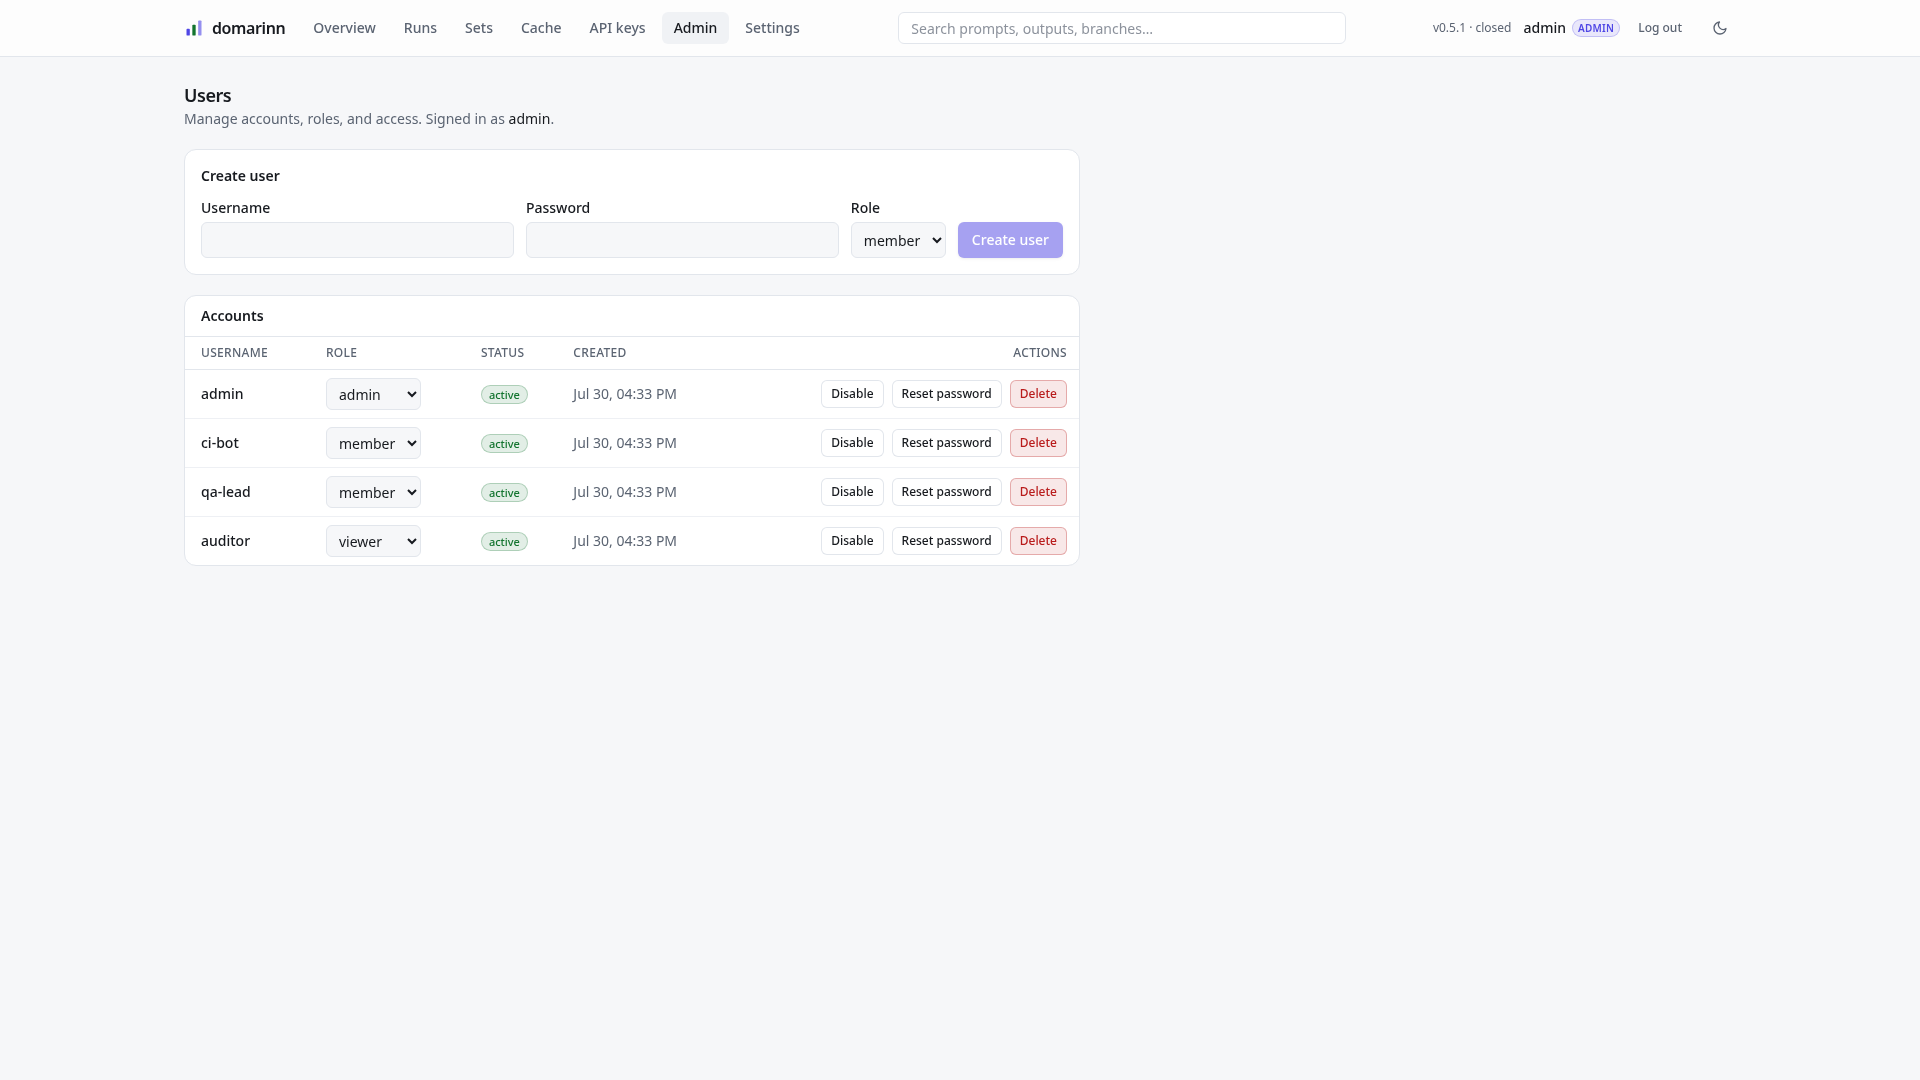
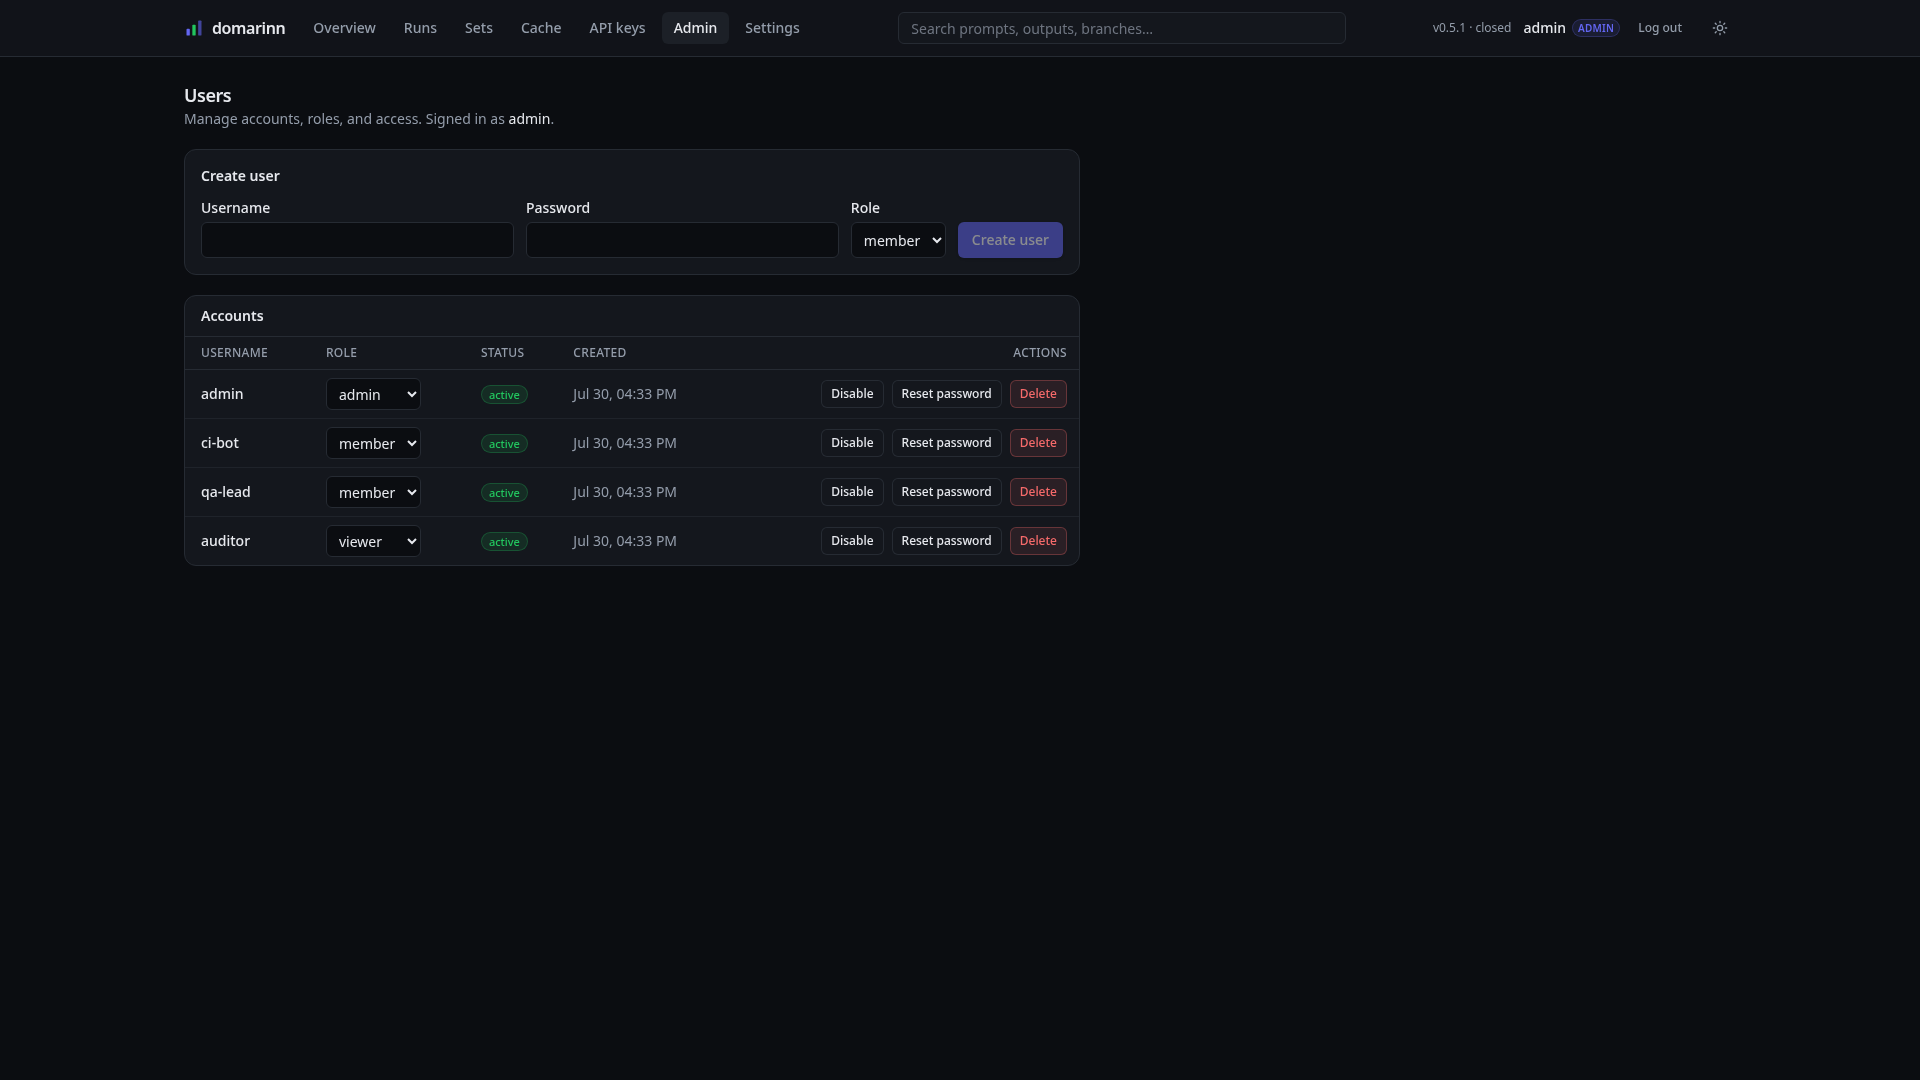
Account management, admin-only, and short by design: create a user with a role, or change a role, disable an account, reset a password, delete. Three roles exist — viewer, member and admin — and each maps to a scope ceiling rather than to a list of permissions: viewer → read, member → write, admin → admin. A viewer browses, mints read-only API keys of its own, and cannot upload a run or change policy; give one a run-set grant and it can reach a restricted set, still read-only. The three accounts under admin in this shot are the seed's, one per grant level on the access list above — which is why one of them is a viewer.
Static bearer tokens never appear here. They are configured in the environment and are not tied to a user, which is exactly why they cannot mint API keys or be revoked from a web page — pull them from the environment and restart. Accounts provisioned by SSO do appear, with their role re-synced from the identity provider on every login — which means a role you set here does not stick for them, and that DOMARINN_SSO_DEFAULT_ROLE re-applies to accounts provisioned long ago (see Server). The one thing that sync will not do is auto-demote your last enabled admin.
Columns
Every table on every page above can be resized and, with two exceptions, narrowed to the columns you care about. Both settings are per-browser, and neither is in the URL: they are a viewing habit, not part of what a shared link means, so sending someone a filtered runs list does not also impose your column layout on them.
Drag the seam on the right of any column header to resize it. The seam is also a real control — tab to it and the arrow keys move it, Home puts it back, and a screen reader announces which column it belongs to and how wide it is in pixels. Double-clicking it resets that one column. Columns above the table hides and shows fields, with Reset returning everything to the layout's own defaults.
Some columns cannot be hidden, and the picker shows why by not offering them. They are the ones a row would be meaningless without: which run or case it is, whether an account is disabled, the buttons that act on it. The last visible column cannot be unchecked either — a table with no columns has no picker to bring them back.
The two exceptions:
- The access list on a run set has three columns, all of them structural, so it resizes but has no picker to open.
- The matrix has one column per provider, derived from the run being viewed. A remembered preference there would key on names the next run may not have, and
?provider=and?prompt=already do that job — so only the stickyTestcolumn resizes.
See also
- Server — auth modes, credentials, SSO, environment variables, storage.
- REST API — the JSON surface every view above reads from.
- Self-hosting — Docker, Compose, Kubernetes, backups.
- Statistics — what the significance panel is computing.