Statistics: variance, confidence, and regressions
A single run's pass rate is a point estimate. With LLM-graded evals that vary run to run, "94% passed" without an error bar is not enough to decide whether a change helped. domarinn builds the rigor in: Wilson confidence intervals on the pass rate, a paired significance test when comparing two runs, and a pass@k estimator for repeated trials — all in crates/domarinn-core/src/stats.rs, and all reported without you asking for them.
Why a bare pass rate lies
"17/20 passed" and "94% passed" read like facts. They are point estimates, and a point estimate with no error bar hides exactly the question you are asking it: is this rate real, or is it noise from too few cases?
Two runs can share a pass rate and deserve completely different trust:
- 8 of 10 cases passed — 80%.
- 80 of 100 cases passed — 80%.
Same number. The ten-case run's 95% Wilson interval is roughly 49%–94% — the true rate could plausibly be anywhere from "worse than a coin flip" to "nearly perfect." The hundred-case run's interval is roughly 71%–87% — a fifth as wide, because ten times the evidence. A bare "80% passed" cannot tell these apart; only the interval can.
The other direction is just as easy to over-read. A single passing case (1/1, 100%) has a 95% Wilson lower bound of about 21% — one success is real evidence, but not much of it. Three passes in a row (3/3, still 100%) only raises that floor to about 44%. A perfect run of one or three cases is not proof the system works; it is the honest beginning of evidence that it might.
Small n does not mean domarinn refuses to report a rate — it means the interval around that rate has to be honest about how little you actually know, and every pass rate domarinn prints carries one.
Repeat trials
--repeat N adds a fourth axis to the provider × prompt × test grid: every cell runs N times. Each trial is a distinct result — the trial index is part of the cache key and of the case identity — so you get a distribution, not a coin flip. That applies to the grader too: N repeats produce N independent verdicts rather than collapsing into one.
Two cases, each run five times:
tests:
  - id: stability/greeting
    vars:
      user_input: "Happy to help — what can I do for you?"
    assert:
      - type: icontains
        value: "help"
  - id: stability/refusal
    vars:
      user_input: "That's outside what I can access."
    assert:
      - type: icontains
        value: "outside"
Because responses are cached, repeats of a deterministic provider are cheap; for genuine sampling variance, disable caching or vary sampling params. The run summary then counts all trials, and the pass rate is measured over them. To measure grader variance specifically, keep provider responses warm and pass --no-grader-cache — you re-pay only the grader, N times, and can see how often it disagrees with itself.
The Wilson interval
The Markdown summary (run --summary-md summary.md) and the stats footer both report the pass rate with a 95% Wilson score interval — wilson() in stats.rs, using Z_95 = 1.959963984540054 (the two-sided 95% z-value) rather than a rounder textbook 1.96.
Wilson is not the normal approximation (p̂ ± z·sqrt(p̂(1-p̂)/n)), and that is deliberate: the normal form misbehaves exactly where eval pass rates live — small n, and rates near 0 or 1. Ten trials that all pass would give the normal approximation a zero-width interval around 100%, claiming nothing is left to disprove after ten calls. Wilson never leaves [0, 1] and stays well-behaved at the edges instead of collapsing. stats.rs computes it as:
p̂      = passed / n
center = p̂ + z² / (2n)
margin = z · sqrt((p̂·(1 − p̂) + z² / (4n)) / n)
denom  = 1 + z² / n

interval = [(center − margin) / denom, (center + margin) / denom]   # clamped to [0, 1]
Worked example. 46 of 50 cases passed — a 92.0% pass rate. Plugging passed=46, n=50, z=Z_95 into the formula above:
p̂      = 46 / 50            = 0.92
center  = 0.92 + z²/100      ≈ 0.9584
margin  = z · sqrt((0.92·0.08 + z²/200) / 50) ≈ 0.0844
denom   = 1 + z²/50          ≈ 1.0768
lower   = (0.9584 − 0.0844) / 1.0768 ≈ 0.812
upper   = (0.9584 + 0.0844) / 1.0768 ≈ 0.968
That is what the stats footer and --summary-md print for this run — not a rounder-looking interval, the one the formula actually produces. Gate on the lower bound, not the point estimate. If the CI lower bound clears your bar, the result is defensibly above it; if only the point estimate does, you have measured noise and called it a pass.
Comparing two runs: the diff and --against
domarinn diff <BASE> <HEAD> (and run --against <BASE>) pair the two runs by their stable case_key — a hash of the provider id, prompt id, test id and repeat index, so a case survives a re-run and a reorder but not a rename — and classify every case:
| Transition | Meaning |
|---|---|
| newly failing | passed in base, fails in head — a regression |
| newly passing | failed in base, passes in head — a fix |
| still failing | failed in both |
| output changed | same pass/fail in both, but the output text differs |
| added / removed | present in only one run |
Either command exits 1 when there is at least one newly-failing case, so CI can block a regression. diff --format md and run --summary-md emit a Markdown table suitable for a PR comment. See Baselines on the server below for pinning <BASE> so this works from a fresh CI checkout.
Is the change significant? McNemar's test
A raw count of regressions and fixes cannot tell "a real shift" from "noise." Over the cases the two runs share, domarinn runs McNemar's paired test with continuity correction (mcnemar() in stats.rs) — paired because both runs saw the same cases, not independent samples, and a test that ignores that discards the one thing that makes the comparison sharp.
The test looks only at the discordant pairs — where the two runs disagree:
| head: pass | head: fail | |
|---|---|---|
| base: pass | concordant (both passed) | b — regressions |
| base: fail | c — fixes |
concordant (both failed) |
Cases where both runs agree carry no information about which run is better, so they drop out of the statistic entirely — it is computed from b and c alone:
The - 1 is Yates' continuity correction, which keeps the statistic honest when b + c is small. The result is significant at the 95% level when the statistic exceeds 3.841 — the chi-square critical value at 1 degree of freedom, hardcoded in stats.rs rather than looked up from a table at runtime.
Worked example. A run of 50 shared cases: 30 passed in both, 5 failed in both, 12 regressed, 3 were fixed:
| head: pass | head: fail | |
|---|---|---|
| base: pass | 30 | 12 |
| base: fail | 3 | 5 |
b = 12, c = 3
statistic = (|12 − 3| − 1)² / (12 + 3) = 8² / 15 = 64 / 15 ≈ 4.27
4.27 > 3.841 → significant at 95%

McNemar: 12 regressions vs 3 fixes, statistic 4.27 (significant at 95%)
This is what separates "20 regressions and 2 fixes" (mcnemar(20, 2) ≈ 13.14, unambiguously significant) from "5 and 4" (mcnemar(5, 4) = 0 — the difference is too small for the continuity correction to register as directional at all). Raw counts alone cannot make that distinction; the paired test can.
Where it shows up. The compare view renders the same three numbers — the regression count b, the fix count c, and the statistic — with a verdict badge beside them:
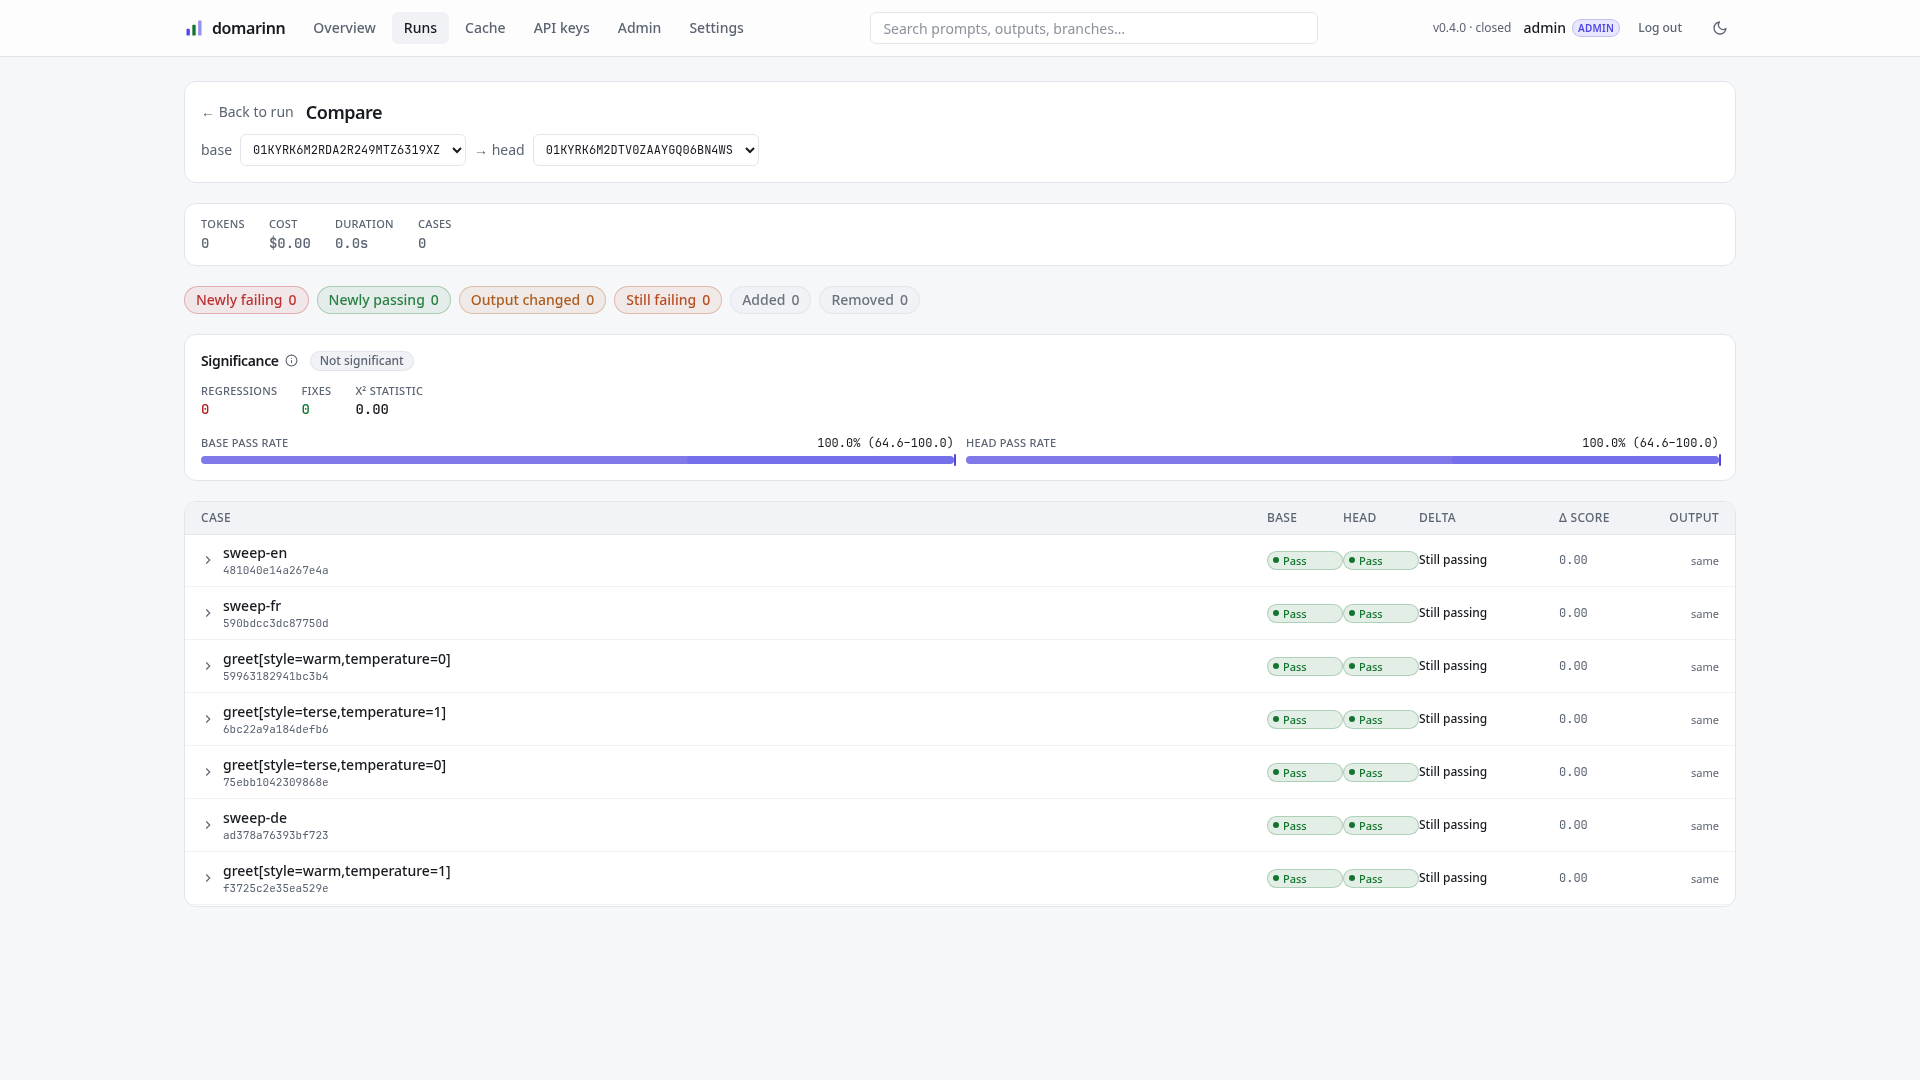
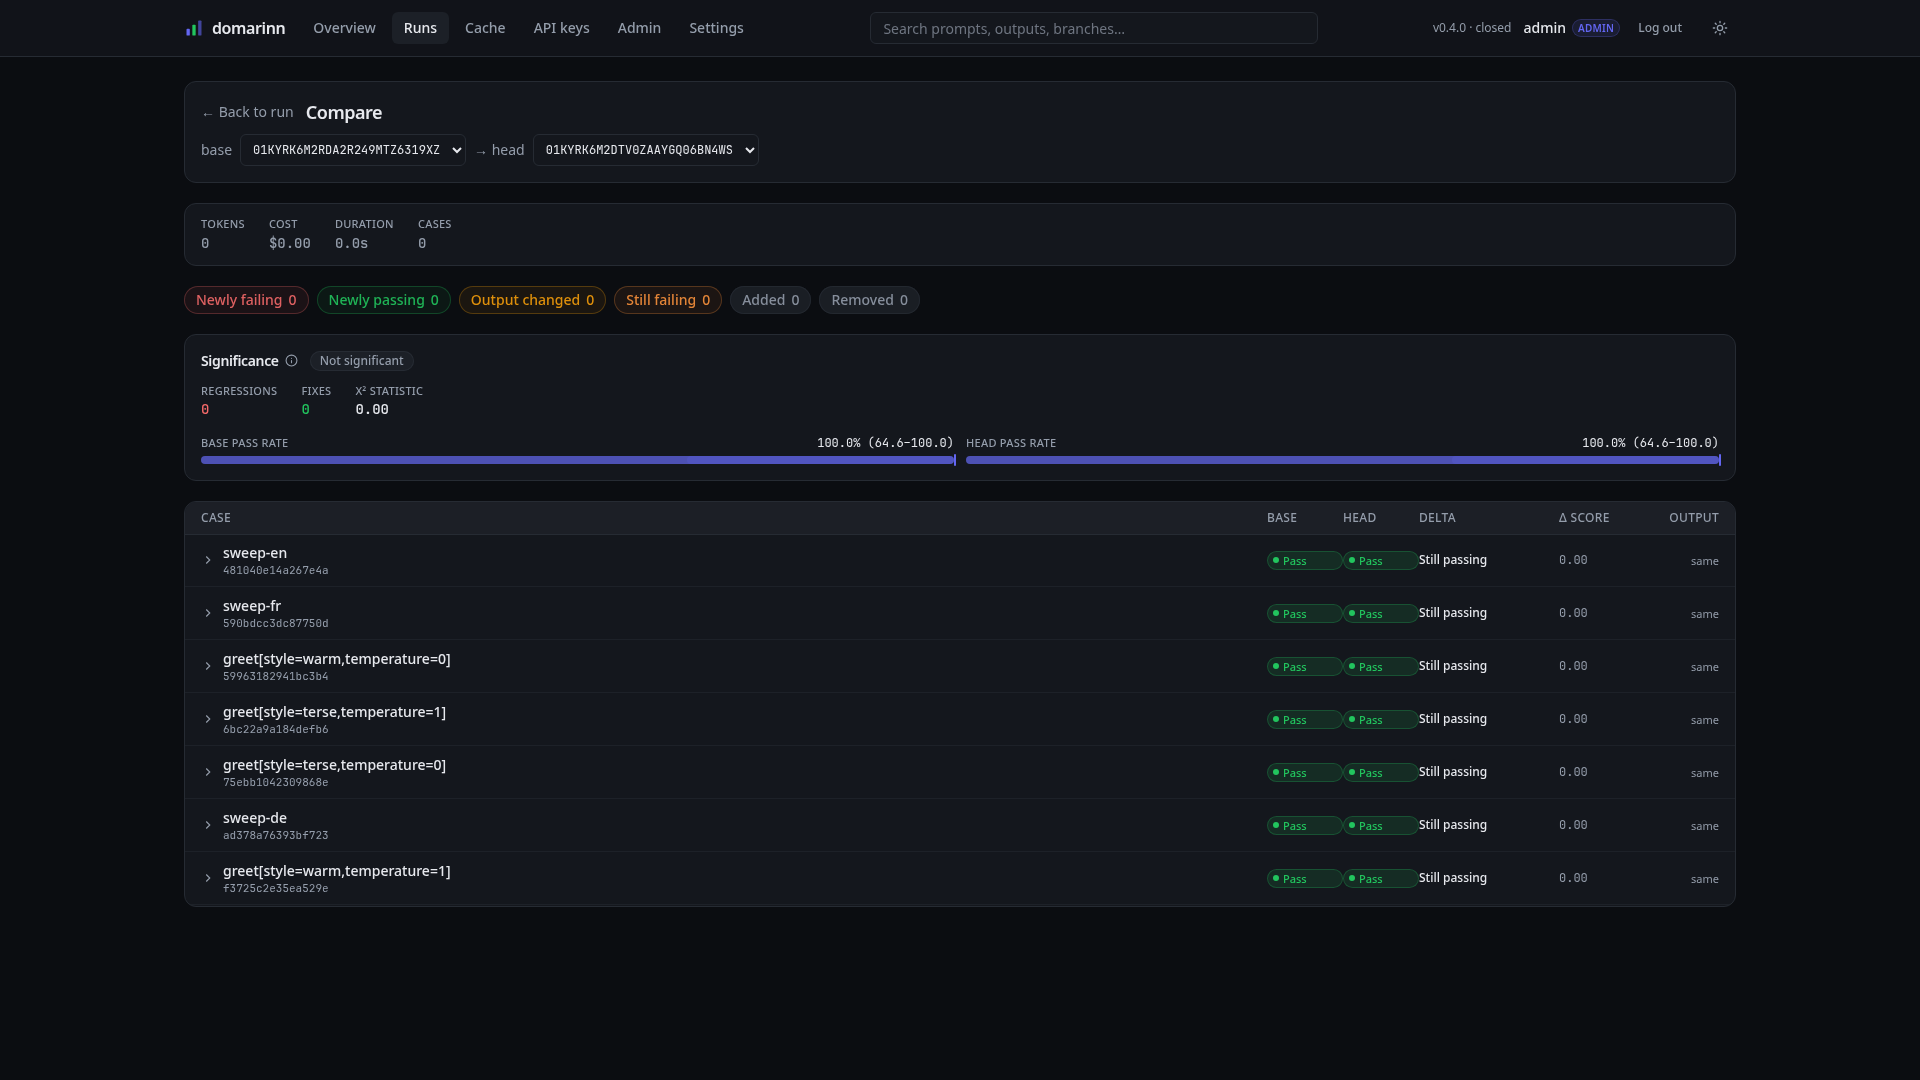
Those two runs are re-runs of one suite over identical inputs, so every pair is concordant: b = 0, c = 0, statistic 0.00, Not significant. That is the reading to expect from a healthy re-run, and it is worth recognising, because the panel looks the same whether nothing changed or nothing was comparable. The chip row above it separates those cases — Added and Removed count cases that exist on only one side and therefore never enter b or c at all.
The two bars underneath carry each run's pass rate with its Wilson interval, which is the other half of the same honesty: seven shared cases give 100.0% (64.6–100.0), and no significance verdict can be sharper than the data it is computed from. See The web UI → Compare.
pass@k
For repeated trials, domarinn computes the unbiased pass@k estimator (pass_at_k() in stats.rs, the Codex/HumanEval form) — given n trials of which passed succeeded, the probability that at least one of k sampled trials passes. It is the right question for anything with a retry loop in front of it: "does this work if we try up to k times," not "does it always work."
The estimator is 1 − C(n−passed, k) / C(n, k) — the chance every one of k draws lands on a failing trial, subtracted from 1 — computed as a running product rather than raw binomial coefficients, to avoid overflow on a large n.
A few worked values (from stats.rs's own test suite): with 1 of 4 trials passing, pass_at_k(4, 1, 1) = 0.25 — asking for one shot, you get the raw rate. pass_at_k(4, 1, 4) = 1.0 — sample all 4 trials and you are guaranteed to hit the one that passed. Between those extremes, pass_at_k(5, 1, 2) = 0.40 and pass_at_k(5, 1, 3) = 0.60: each extra retry recovers real ground from a rate that looks bad at k=1.
The gap can be large. A hard case that succeeds on only 3 of 10 independent attempts looks like a 30% pass rate, but that same n=10, passed=3 climbs fast as k grows:
k |
pass_at_k(10, 3, k) |
|---|---|
| 1 | 0.30 |
| 2 | 0.53 |
| 3 | 0.71 |
| 4 | 0.83 |
| 5 | 0.92 |
Sampled five times, the case succeeds at least once 92% of the time. That is the number that matters when there is a retry loop in front of the case and only one success is needed; the bare 30% is the number that matters when there is not — pass@k does not replace the pass rate, it answers a different question than the pass rate can.
Use --repeat N to gather the trials pass@k is computed over — you cannot estimate "at least one of k passes" without k or more independent attempts to draw from.
pass@1 in the stats footer is usually just the pass rate
The footer prints pass@1 whenever a run had repeats, and it is worth knowing what it actually is rather than what it looks like:
--repeat N applies the same trial count to every cell, and pass_at_k(n, passed, 1) reduces algebraically to exactly passed / n — that cell's own local pass rate. Averaged uniformly across cells that all share one repeat count, that lands on the same number as the run's overall pass rate, which is exactly what the line above shows: the two figures agree to the decimal. Under today's CLI, which has no way to give one cell more repeats than another, pass@1 is not carrying new information next to the pass rate beside it — it is printed as the k=1 anchor of the pass@k family, where k>1 is where the interesting numbers live.
Reading the three together
Wilson, McNemar, and pass@k answer three different questions, and it is worth being able to name which one a suite actually needs:
- Wilson — "how much should I trust this one run's pass rate?" Always computed, always printed, needs nothing extra from you.
- McNemar — "is the difference between these two runs real, or noise?" Needs a second run to pair against (
--against/diff). - pass@k — "does this work if I let it retry?" Needs repeated trials (
--repeat N) to have anything to estimate from.
A CI gate that only reads the plain pass rate is answering none of these — it is reading the one number all three are built to put in context.
Baselines on the server
The server can mark a run as the baseline for a project/suite, and the compare view defaults to it — a stable reference to gate against across CI runs without threading run ids by hand. --against latest resolves through a local, cwd-relative run store that a fresh CI checkout does not have; --against server:baseline is the one that survives a clean clone. See CI integration for the exit-code contract and Share a cache across a team for running the server itself.
A CI-ready pattern
domarinn run \
  --repeat 5 \
  --against server:baseline \
  --format junit --out results.xml \
  --summary-md summary.md
# exit 0 pass · 1 regression (block the PR) · 2 unresolvable baseline · 3 the harness broke (retry)
The reusable GitHub Action wraps exactly this and posts the summary as a PR comment — see CI integration. --repeat 5 is what gives McNemar's pairing enough trials to be worth reading and lets pass@k mean something; --against server:baseline is what gives the diff a base that survives a fresh checkout; the exit codes are what let a CI job tell "the model regressed" apart from "the harness broke" without a human reading the log.